Copyright
©2005 Baishideng Publishing Group Inc.
World J Gastroenterol. Dec 21, 2005; 11(47): 7430-7435
Published online Dec 21, 2005. doi: 10.3748/wjg.v11.i47.7430
Published online Dec 21, 2005. doi: 10.3748/wjg.v11.i47.7430
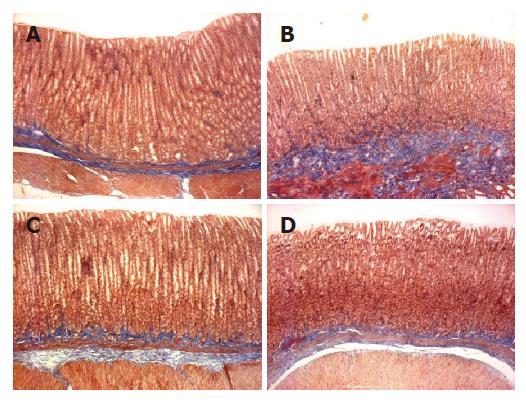
Figure 1 Microscopic appearance of gastric mucosa showing the effect of DA-9601 and rebamipide on sodium taurocholate (TCA)-induced erosive and atrophic gastritis in rats (×100).
Rats were administered with 5 mmol/L TCA for
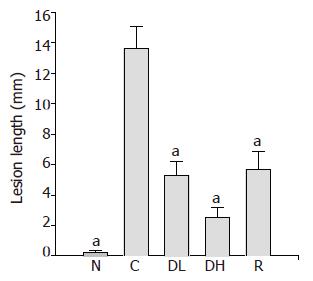
Figure 2 Inhibitory effects of DA-9601 and rebamipide on the length of mucosal lesion of TCA-induced erosive and atrophic gastritis in rats.
DA-9601 (0.065% and 0.0.216%) and rebamipide (1.08%) were mixed with rodent chow and then administered to the rats. N: Normal; C: control; DL: 0.065% DA-9601; DH: 0.216% DA-9601; R: 1.08% rebamipide. Data are expressed as mean±SE. aP<0.05 vs controls.
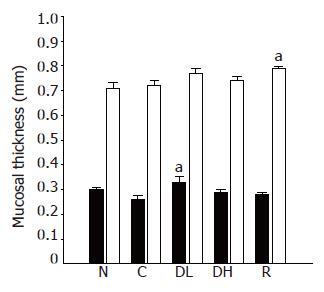
Figure 3 Effects of DA-9601 and rebamipide on the mucosal thickness of TCA-induced erosive and atrophic gastritis in rats.
N: Normal; C: control; DL: 0.065% DA-9601; DH: 0.216% DA-9601; R: 1.08% rebamipide. Data are expressed as mean±SE. aP<0.05 vs controls.
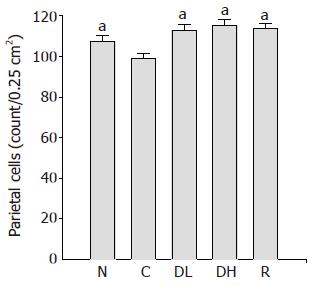
Figure 4 Effects of DA-9601 and rebamipide on the number of parietal cells in TCA-induced erosive and atrophic gastritis in rats.
N: Normal; C: control; DL: 0.065% DA-9601; DH: 0.216% DA-9601; R: 1.08% rebamipide. Data are expressed as mean±SE. aP<0.05 vs controls.
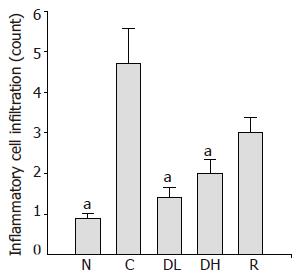
Figure 5 Effects of DA-9601 and rebamipide on the infiltration of inflammatory cells induced by TCA.
N: Normal; C: control; DL: 0.065% DA-9601; DH: 0.216% DA-9601; R: 1.08% rebamipide. Data are expressed as mean±SE. aP<0.05 vs controls.
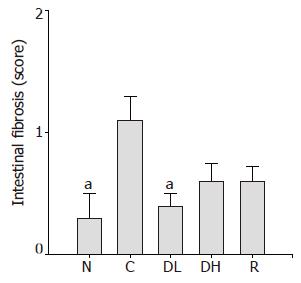
Figure 6 Effects of DA-9601 and rebamipide on the proliferation of collagenous fiber induced by TCA in rats.
N: Normal; C: control; DL: 0.065% DA-9601; DH: 0.216% DA-9601; R: 1.08% rebamipide. Data are expressed as mean±SE. aP<0.05 vs controls.
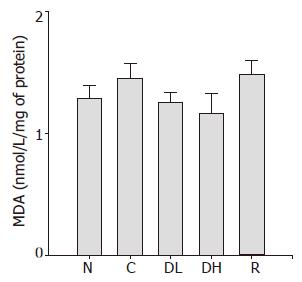
Figure 7 Effects of DA-9601 and rebamipide on malondialdehyde (MDA) induced by TCA in rat gastric mucosa.
N: Normal; C: control; DL: 0.065% DA-9601; DH: 0.216% DA-9601; R: 1.08% rebamipide. Data are expressed as mean±SE. aP<0.05 vs controls.
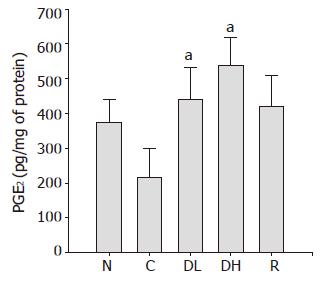
Figure 8 Effects of DA-9601 and rebamipide on PGE2 induced by TCA in rat gastric mucosa.
N: normal; C: control; DL: 0.065% DA-9601; DH: 0.216% DA-9601; R: 1.08% rebamipide. Data are expressed as mean±SE. aP<0.05 vs controls.
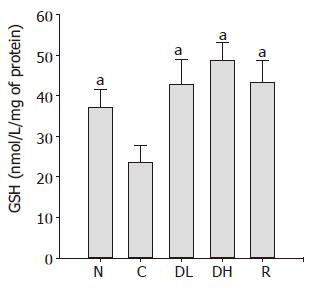
Figure 9 Effects of DA-9601 and rebamipide on glutathione (GSH) induced by TCA in rat gastric mucosa.
N: Normal; C: control; DL: 0.065% DA-9601; DH: 0.216% DA-9601; R: 1.08% rebamipide. Data are expressed as mean±SE. aP<0.05 vs controls.
- Citation: Oh TY, Shin CY, Sohn YS, Kim DH, Ahn BO, Lee EB, Park CH. Therapeutic effect of DA-9601 on chronic reflux gastritis induced by sodium taurocholate in rats. World J Gastroenterol 2005; 11(47): 7430-7435
- URL: https://www.wjgnet.com/1007-9327/full/v11/i47/7430.htm
- DOI: https://dx.doi.org/10.3748/wjg.v11.i47.7430


