Copyright
©2005 Baishideng Publishing Group Inc.
World J Gastroenterol. Dec 14, 2005; 11(46): 7368-7373
Published online Dec 14, 2005. doi: 10.3748/wjg.v11.i46.7368
Published online Dec 14, 2005. doi: 10.3748/wjg.v11.i46.7368
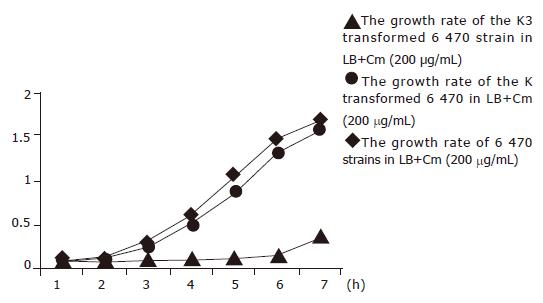
Figure 1 Growth curve of the transformants in the broth containing Cm after K3 plasmid and K plasmid were introduced into 6 470 strains of Cm-resistant E coli.
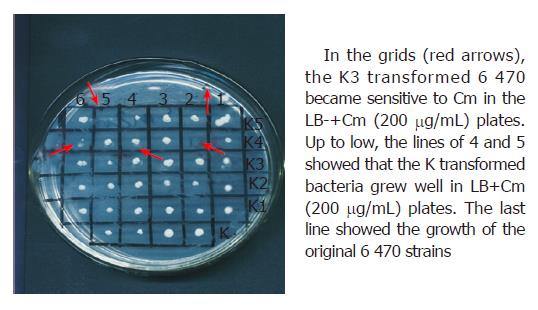
Figure 2 Susceptibility test of the transformed bacteria in solid culture containing Cm (200 μg/mL) after K3 plasmids and K plasmids were introduced into 6 470
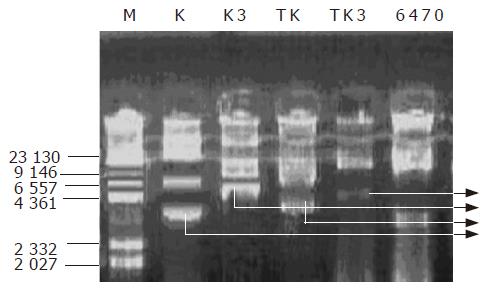
Figure 3 Results of rapid plasmid extraction after K3 plasmid and K plasmid were introduced into 6 470, K and TK, K3 and TK3 can be detected in similar bands.
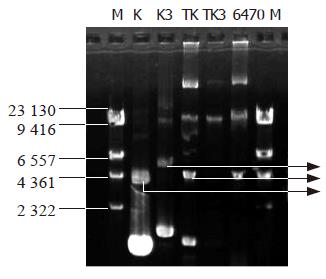
Figure 4 The map of plasmid extraction after the transformants were cultured for 2 d, K and TK can be detected in similar bands, while TK3 had no similar bands as K3, indicating the K3 plasmid was lost or had been degraded.
M: Marker; lane K: control plasmid; K3; EGS plasmid; TK, 6 470 transformed with K plasmid; TK3, 6 470 transformed with K3; 6 470, original Cm-resistant 6 470.
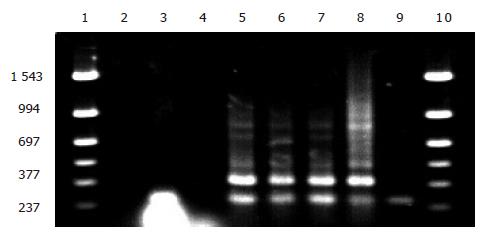
Figure 5 Electrophoresis of PCR amplification of EGS genes in the transformed bacteria after K plasmid and K3 plasmid introduced into 6 470.
Lanes 1 and 10 Mmarker; Llane 2, blank control; lane 3, transformants cultured 2 d more; lane 4, original 6 470 strains; lanes 5, 6 and 7: 6 470 derivatives transformed with K3; lane 8: plasmid K3 (positive control); lane 9: K plasmid transformants (negative control).
- Citation: Gao MY, Xu CR, Chen R, Liu SG, Feng JN. Chloromycetin resistance of clinically isolated E coli is conversed by using EGS technique to repress the chloromycetin acetyl transferase. World J Gastroenterol 2005; 11(46): 7368-7373
- URL: https://www.wjgnet.com/1007-9327/full/v11/i46/7368.htm
- DOI: https://dx.doi.org/10.3748/wjg.v11.i46.7368


