Copyright
©2005 Baishideng Publishing Group Inc.
World J Gastroenterol. Dec 14, 2005; 11(46): 7364-7367
Published online Dec 14, 2005. doi: 10.3748/wjg.v11.i46.7364
Published online Dec 14, 2005. doi: 10.3748/wjg.v11.i46.7364
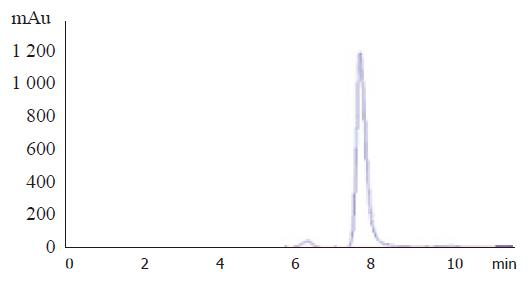
Figure 1 Standard C18 PAF.
The horizontal and vertical axes represent the retention time (min) and milli-absorption unit (mAu) respectively, by which the peak area was calculated.
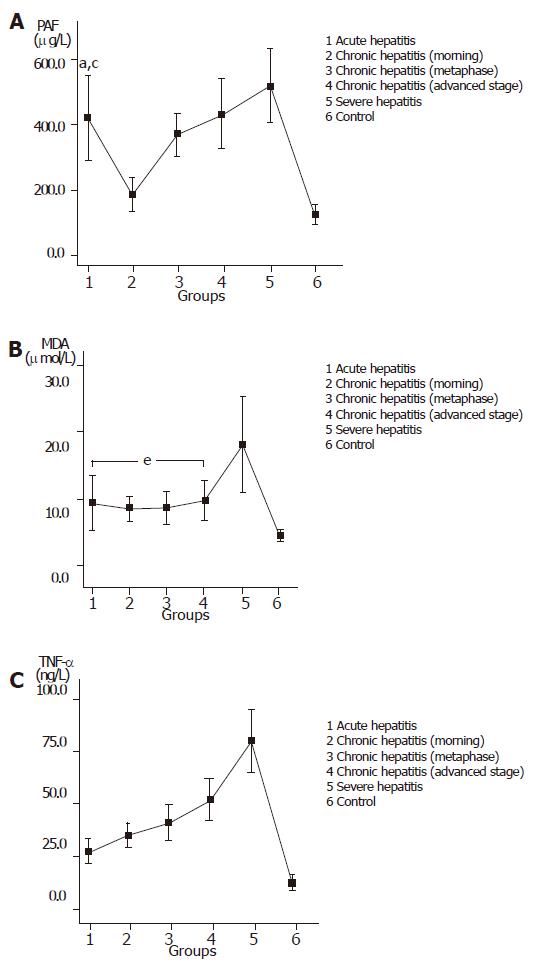
Figure 2 Plasma or serum levels of PAF (A), MDA (B) and TNF-α (C) in patients and controls.
The values of PAF, TNF-α and MDA in patients with hepatitis were significantly higher than those in controls (P<0.01). aP<0.05 vs group 3, cP>0.05 vs group 4, eP>0.05 vs every two groups in groups 1-4.
- Citation: Cao HC, Chen XM, Xu W. Determination of platelet-activating factor by reverse phase high-performance liquid chromatography and its application in viral hepatitis. World J Gastroenterol 2005; 11(46): 7364-7367
- URL: https://www.wjgnet.com/1007-9327/full/v11/i46/7364.htm
- DOI: https://dx.doi.org/10.3748/wjg.v11.i46.7364


