Copyright
©2005 Baishideng Publishing Group Inc.
World J Gastroenterol. Dec 14, 2005; 11(46): 7296-7301
Published online Dec 14, 2005. doi: 10.3748/wjg.v11.i46.7296
Published online Dec 14, 2005. doi: 10.3748/wjg.v11.i46.7296
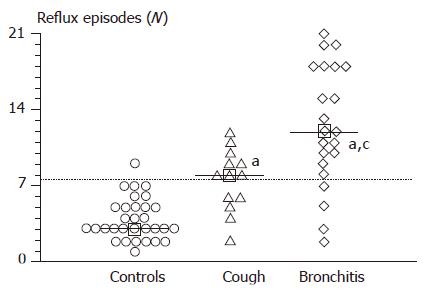
Figure 1 Number of postcibal gastro-esophageal reflux episodes, as determined by ultrasound, in controls (n = 31) and in infants with recurrent respiratory diseases (n = 35).
Horizontal dotted line indicates the mean+2SD in the normal control group. Squares and continuous horizontal lines indicate medians. Differences between the groups were tested by using ANOVA, followed by Fisher’s LSD multiple comparison test. aP<0.05 vs controls; cP<0.05 vs chronic cough.
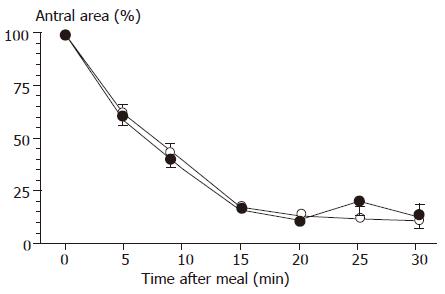
Figure 2 Postcibal gastric emptying curves, determined by ultrasound, in controls (n = 31) and in infants with recurrent respiratory diseases (n = 35).
Symbols indicate means ( : controls; : patients), and vertical lines indicate SE. Differences between groups were tested by using ANOVA.
- Citation: Ciaula AD, Portincasa P, Terlizzi LD, Paternostro D, Palasciano G. Ultrasonographic study of postcibal gastro-esophageal reflux and gastric emptying in infants with recurrent respiratory disease. World J Gastroenterol 2005; 11(46): 7296-7301
- URL: https://www.wjgnet.com/1007-9327/full/v11/i46/7296.htm
- DOI: https://dx.doi.org/10.3748/wjg.v11.i46.7296


