Copyright
©2005 Baishideng Publishing Group Inc.
World J Gastroenterol. Dec 14, 2005; 11(46): 7272-7276
Published online Dec 14, 2005. doi: 10.3748/wjg.v11.i46.7272
Published online Dec 14, 2005. doi: 10.3748/wjg.v11.i46.7272
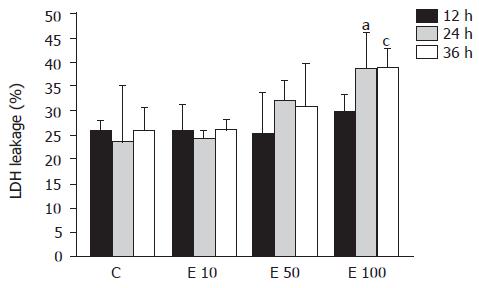
Figure 1 Lactate dehydrogenase (LDH) leakage of primary rat hepatocytes in each group.
Data are mean±SD for 3 hepatocyte preparations. Cultures were incubated without ethanol (C), with 10 mmol/L ethanol (E 10), with 50 mmol/L ethanol (E 50), and with 100 mmol/L ethanol (E 100) for 12, 24, and 36 h, respectively. aP<0.05 vs 24 h of group C and E 10; cP<0.05 vs 36 h of groups C and E 10.
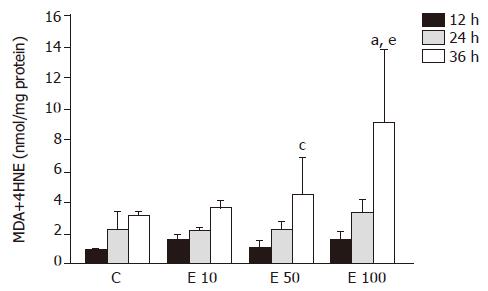
Figure 2 Lipid peroxidation of primary rat hepatocytes in each group.
Lipid peroxidation was estimated by the measurement of MDA. Data are mean±SD for 3 hepatocyte preparations. Cultures were incubated without ethanol (C), with 10 mmol/L ethanol (E 10), with 50 mmol/L ethanol (E 50), and with 100 mmol/L ethanol (E 100) for 12, 24, and 36 h, respectively. aP<0.05 vs 36 h of groups C, E 10 and E 50; cP<0.05 vs 12 h of group E 50; eP<0.05 vs 12 h and 24 h of group E 100.
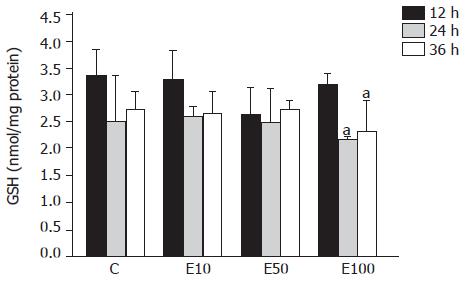
Figure 3 Glutathione (GSH) concentrations of primary rat hepatocytes in each group.
Data are mean±SD for 3 hepatocyte preparations. Cultures were incubated without ethanol (C), with 10 mmol/L ethanol (E 10), with 50 mmol/L ethanol (E 50), and with 100 mmol/L ethanol (E 100) for 12, 24, and 36 h, respectively. aP<0.05 vs 12 h of group E 100.
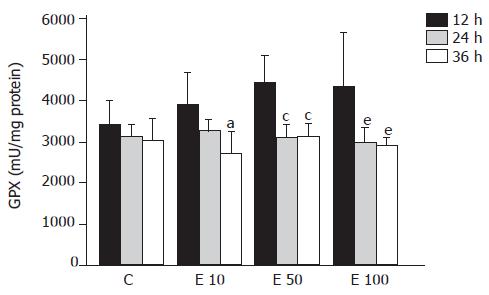
Figure 4 Glutathione peroxidase (GPX) activities of primary rat hepatocytes in each group.
Data are mean±SD for 3 hepatocyte preparations. Cultures were incubated without ethanol (C), with 10 mmol/L ethanol (E 10), with 50 mmol/L ethanol (E 50), and with 100 mmol/L ethanol (E 100) for 12, 24, and 36 h, respectively. aP<0.05 vs 12 h of group E10; cP<0.05 vs 12 h of group E 50; eP<0.05 vs 12 h of group E 100.
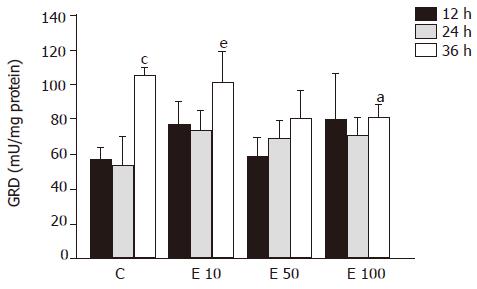
Figure 5 Glutathione reductase (GRD) activities of primary rat hepatocytes in each group.
Data are mean±SD for 3 hepatocyte preparations. Cultures were incubated without ethanol (C), with 10 mmol/L ethanol (E 10), with 50 mmol/L ethanol (E 50), and with 100 mmol/L ethanol (E 100) for 12, 24, and 36 h, respectively. aP<0.05 vs 36 h of groups C and E 10; cP<0.05 vs 12 h and 24 h of groups C; eP<0.05 vs 12 h and 24 h of group E 10.
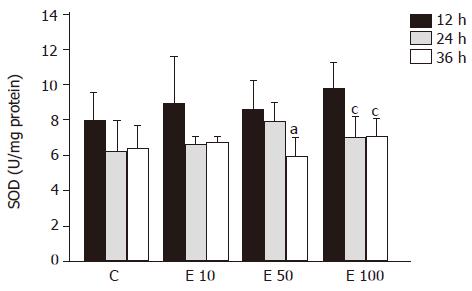
Figure 6 Superoxide dismutase (SOD) activities of primary rat hepatocytes in each group.
Data are mean±SD for 3 hepatocyte preparations. Cultures were incubated without ethanol (C), with 10 mmol/L ethanol (E 10), with 50 mmol/L ethanol (E 50), and with 100 mmol/L ethanol (E 100) for 12, 24, and 36 h, respectively. aP<0.05 vs 12 h of group E50; cP<0.05 vs 12 h of group E 100.
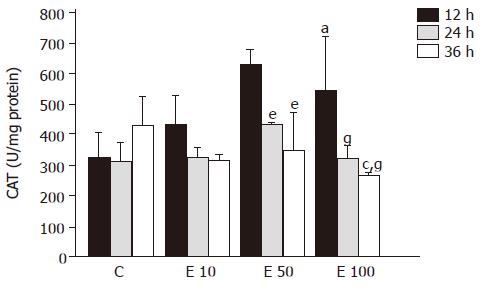
Figure 7 Catalase (CAT) activities of primary rat hepatocytes in each group.
Data are mean±SD for 3 hepatocyte preparations. Cultures were incubated without ethanol (C), with 10 mmol/L ethanol (E 10), with 50 mmol/L ethanol (E 50), and with 100 mmol/L ethanol (E 100) for 12, 24, and 36 h, respectively. aP<0.05 vs 12 h of groups C; cP<0.05 vs 36 h of groups C and E 50; eP<0.05 vs 12 h of group E 50; gP<0.05 vs 12 h of group E 100.
- Citation: Yang SS, Huang CC, Chen JR, Chiu CL, Shieh MJ, Lin SJ, Yang SC. Effects of ethanol on antioxidant capacity in isolated rat hepatocytes. World J Gastroenterol 2005; 11(46): 7272-7276
- URL: https://www.wjgnet.com/1007-9327/full/v11/i46/7272.htm
- DOI: https://dx.doi.org/10.3748/wjg.v11.i46.7272


