Copyright
©2005 Baishideng Publishing Group Inc.
World J Gastroenterol. Dec 7, 2005; 11(45): 7097-7103
Published online Dec 7, 2005. doi: 10.3748/wjg.v11.i45.7097
Published online Dec 7, 2005. doi: 10.3748/wjg.v11.i45.7097
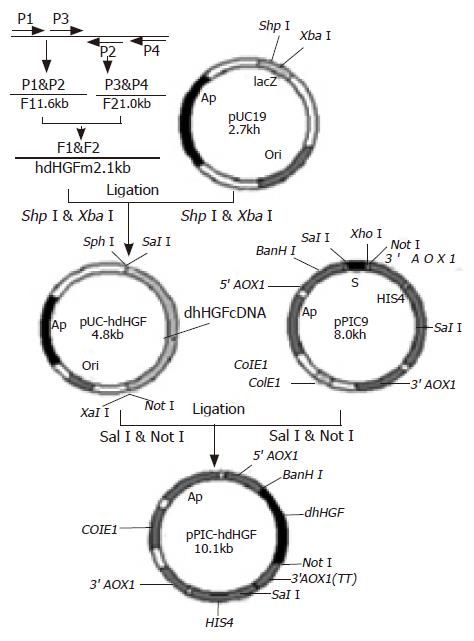
Figure 1 Cloning of hdHGF cDNA and construction of expression vectors pUC-hdHGF and pPIC9-hdHGF.
Figure 2 Schematic representation of hdHGF expression cassettes used.
Arrowhead indicates the cleavage site of Kex2 protease.
Figure 3 Analysis of PCR products by 1% agarose electrophoresis (A and B).
Lane 1: fragment (F2) amplified with P3-P4 primer pair; lane 2: fragment (F1) amplified with P1-P2 primer pair; lane 3: fragment (whole length) amplified with M1-M2 primer pair; M1: 200-bp ladder marker; M2: λ+HindIII marker. The arrowheads show the bands of the interesting fragments
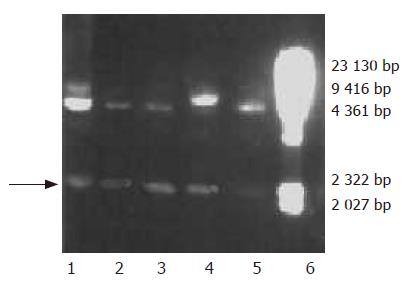
Figure 4 Agarose electrophoresis analysis of restriction enzyme mapping of recombinant plasmids of pPIC9-hdHGF.
Lanes 1-5: recombinant plasmids of pPIC9-hdHGF digested by BamHI and NotI; lane 6: λ-DNA/HindIII marker. The arrowhead reveals bands of the interesting fragment.
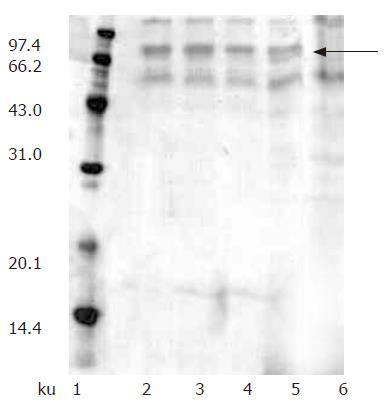
Figure 5 Fifteen percentage SDS-PAGE analysis of high expression strains in shake-flask culture.
Lane 1: LMW marker; lane 2: GH209; lane 3: HG211; lane 4: HG305; lane 5:HG309; lane 6: GS115. The arrowhead shows bands of the interesting protein.
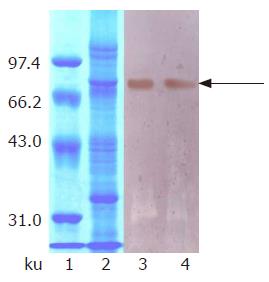
Figure 6 Fifteen percentage SDS-PAGE and Western blotting analysis of the 5-L fed-batch high cell density fermentation of GH209.
Lane 1: LMW marker; lane 2: 10% SDS-PAGE result; lanes 3 and 4: Western blotting result. The arrowhead shows bands of the interesting protein.
- Citation: Liu ZM, Zhao HL, Xue C, Deng BB, Zhang W, Xiong XH, Yang BF, Yao XQ. Secretory expression and characterization of a recombinant-deleted variant of human hepatocyte growth factor in Pichia pastoris. World J Gastroenterol 2005; 11(45): 7097-7103
- URL: https://www.wjgnet.com/1007-9327/full/v11/i45/7097.htm
- DOI: https://dx.doi.org/10.3748/wjg.v11.i45.7097


