Copyright
©2005 Baishideng Publishing Group Inc.
World J Gastroenterol. Nov 28, 2005; 11(44): 6968-6974
Published online Nov 28, 2005. doi: 10.3748/wjg.v11.i44.6968
Published online Nov 28, 2005. doi: 10.3748/wjg.v11.i44.6968
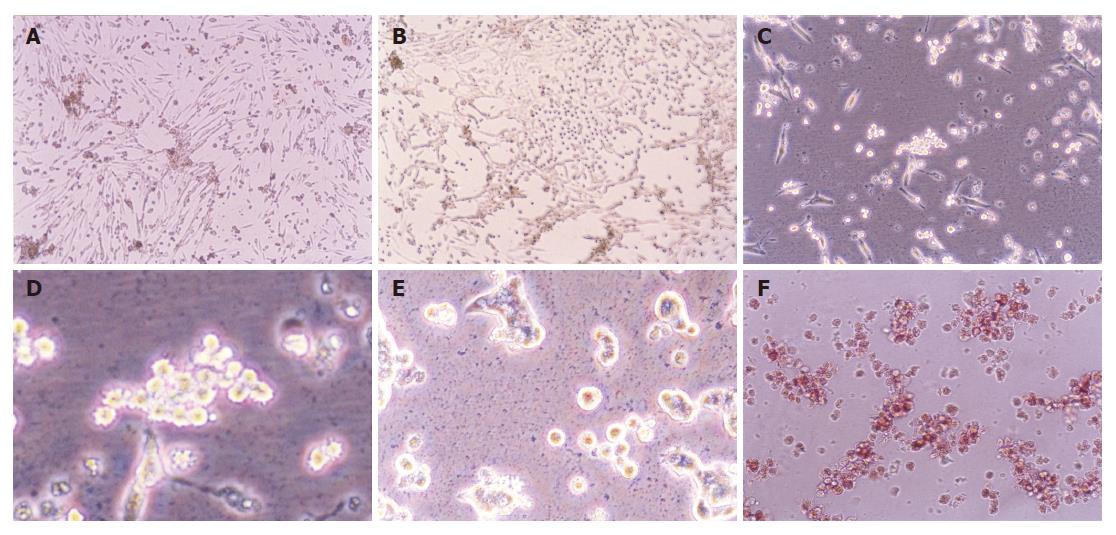
Figure 1 Morphological change of neonatal pancreatic duct cells cultured for 3-4 d (A), 5-7 d (B), 8-10 d (C and D) and more than 10 d (E), as well as identification of pancreatic islet cells by dithizone (F).
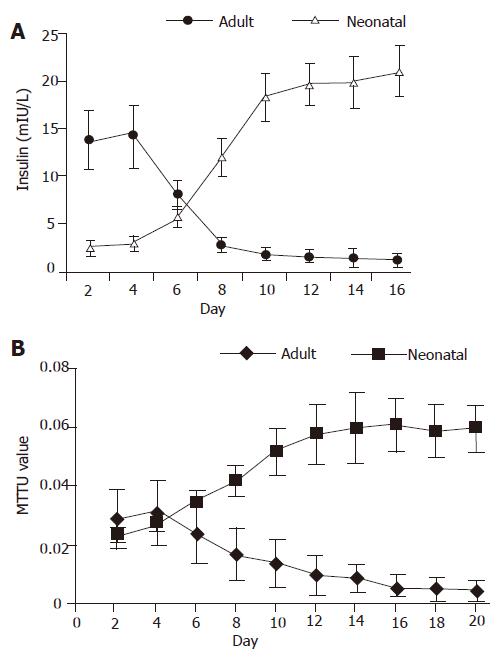
Figure 2 Insulin release curve (A) and MTT value curve (B) during the culture period of isolated adult islet cells and neonatal endocrine cells.
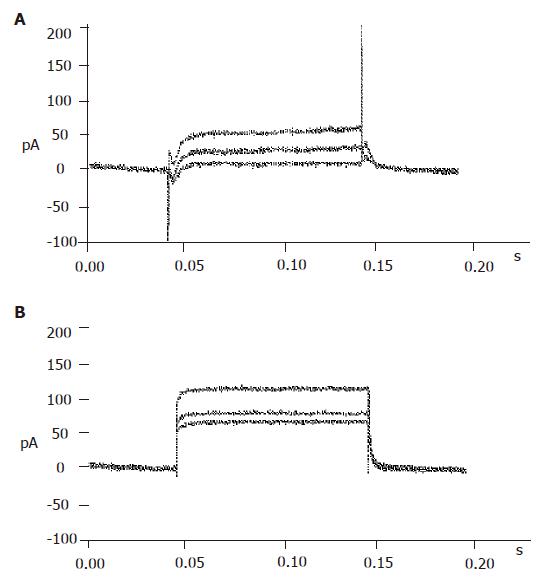
Figure 3 Identification of pancreatic β cells.
A: Currents recorded from α or δ cells; B: currents recorded from β cells.
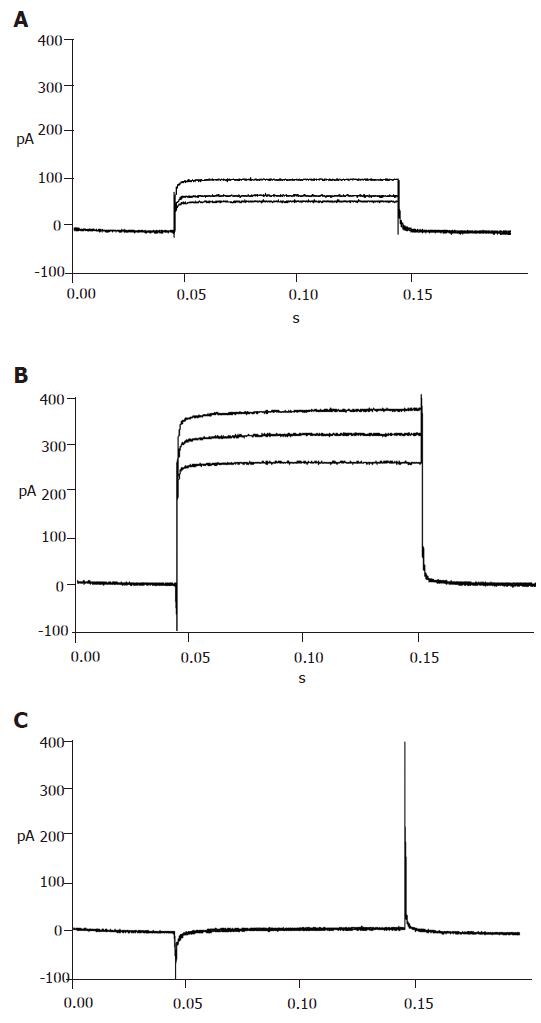
Figure 4 ATP sensitive potassium currents recorded in the absence (A), presence of diazoxide (B) and repaglinide (C).
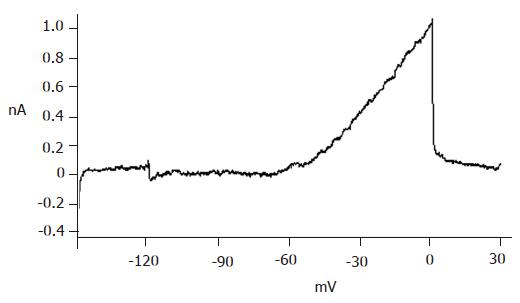
Figure 5 Voltage-dependent potassium currents recorded on neonatal pancreatic β cells.
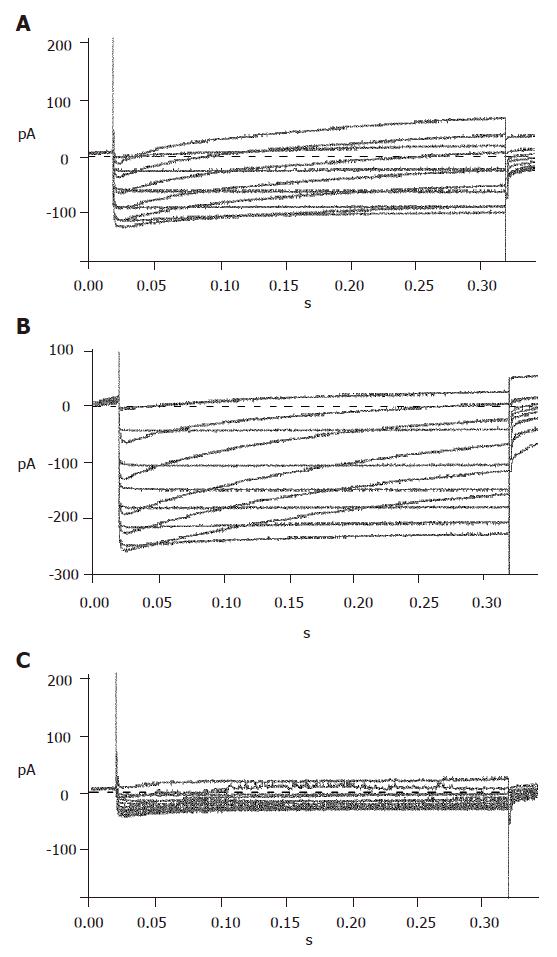
Figure 6 Voltage-dependent calcium currents recorded in the absence (A), presence of Bay K8644 (B) and nifedipine (C).
- Citation: Leng SH, Lu FE. Induction of pancreatic duct cells of neonatal rats into insulin-producing cells with fetal bovine serum: A natural protocol and its use for patch clamp experiments. World J Gastroenterol 2005; 11(44): 6968-6974
- URL: https://www.wjgnet.com/1007-9327/full/v11/i44/6968.htm
- DOI: https://dx.doi.org/10.3748/wjg.v11.i44.6968


