Copyright
©2005 Baishideng Publishing Group Inc.
World J Gastroenterol. Nov 28, 2005; 11(44): 6960-6967
Published online Nov 28, 2005. doi: 10.3748/wjg.v11.i44.6960
Published online Nov 28, 2005. doi: 10.3748/wjg.v11.i44.6960
Figure 1 NF-κB activation in the liver graft.
Lanes 1: Hepatic nuclear protein extracts from sham control rat; Lanes 2-8: Liver graft nuclear protein extracts on 0, 0.5, 1, 2, 4, 8 and 16 h after reperfusion.
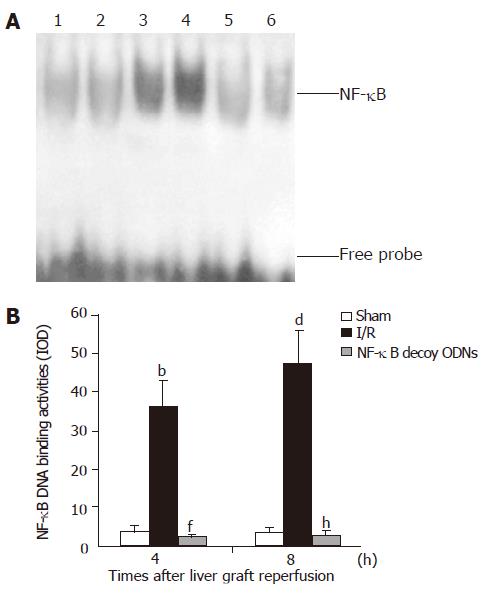
Figure 2 Hepatic NF-κB activation (A) and NF-κB DNA binding activities presented as IOD value (B).
Lanes 1 and 2: Hepatic RNA extracts from sham control group. Lanes 3 and 4: Hepatic RNA extracts from I/R group. Lanes 5 and 6: Hepatic RNA extracts from I/R + NF-κB decoy ODNs group. b, dP<0.001 vs sham group, f, hP<0.001 vs I/R group.
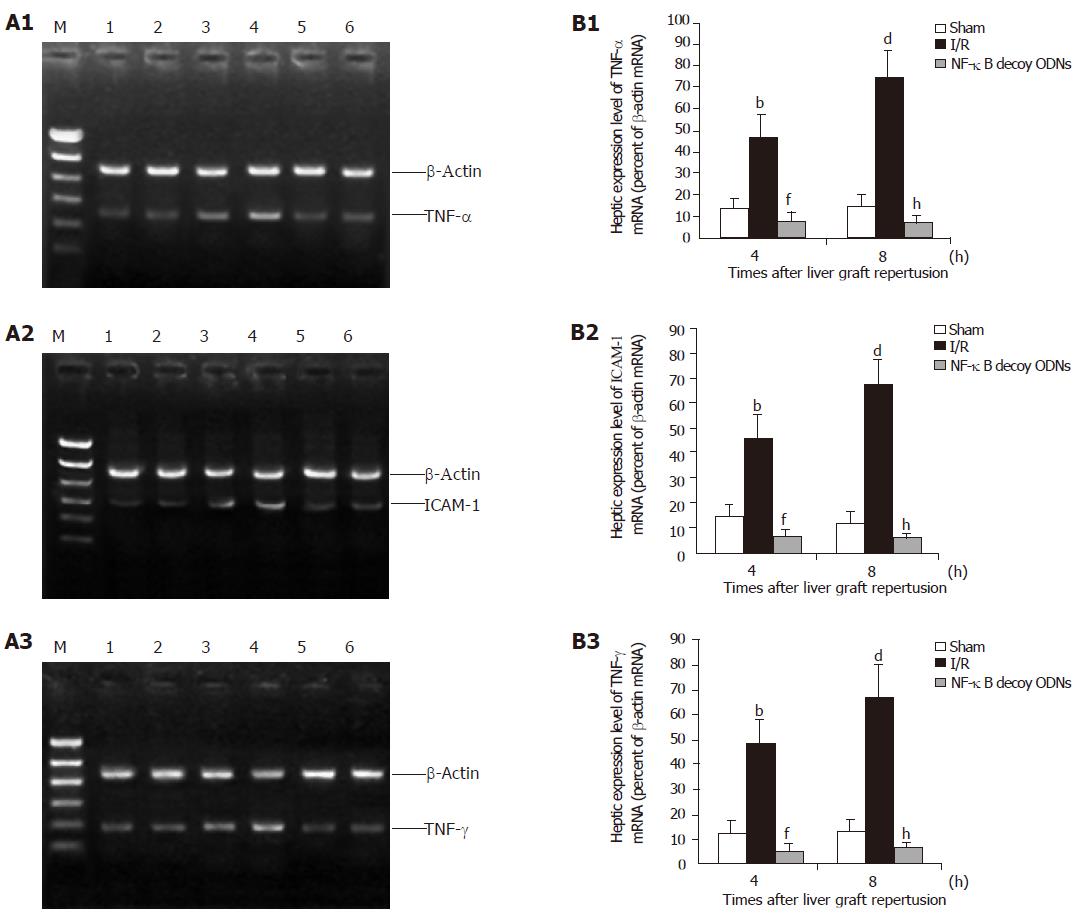
Figure 3 Hepatic expression (A) and the expression level (B) of cytokine mRNA after 4 and 8 h of reperfusion.
Lanes 1 and 2: Hepatic RNA extracts from sham control group. Lanes 3 and 4: Hepatic RNA extracts from I/R group. Lanes 5 and 6: Hepatic RNA extracts from I/R + NF-κB decoy ODNs group. b, dP<0.001 vs sham group; f, hP<0.001 vs I/R group.
Figure 4 Serum levels of TNF-α (A) and IFN-γ (B) after hepatic ischemia/reperfusion.
bP<0.001 vs I/R group.
Figure 5 Hepatic MPO content (A) and serum level of ALT (B).
bP<0.001 vs I/R group.
- Citation: Xu MQ, Shuai XR, Yan ML, Zhang MM, Yan LN. Nuclear factor-κB decoy oligodeoxynucleotides attenuates ischemia/reperfusion injury in rat liver graft. World J Gastroenterol 2005; 11(44): 6960-6967
- URL: https://www.wjgnet.com/1007-9327/full/v11/i44/6960.htm
- DOI: https://dx.doi.org/10.3748/wjg.v11.i44.6960


