Copyright
©2005 Baishideng Publishing Group Inc.
World J Gastroenterol. Nov 21, 2005; 11(43): 6833-6838
Published online Nov 21, 2005. doi: 10.3748/wjg.v11.i43.6833
Published online Nov 21, 2005. doi: 10.3748/wjg.v11.i43.6833
Figure 2 Mean TGF-β1 (A), TIMP-1 (B), and MMP-1 (C) plasma concentrations before and during IFN-α plus RBV therapy as well as 24 wk after its completion (wk 72) in respect to the treatment efficacy.
Statistical significance in comparison to normal values is indicated with asterisks and between groups with arrows.
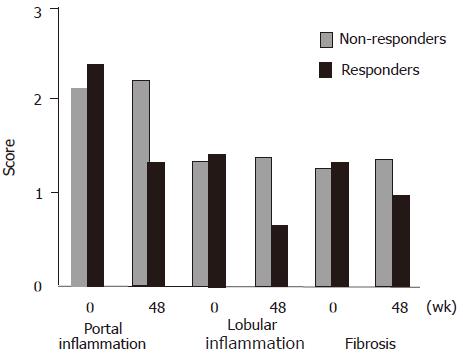
Figure 1 Mean score values of histologic changes in liver biopsy specimens before (wk 0) and after (wk 48) treatment.
Statistically significant difference is indicated with arrows.
- Citation: Flisiak R, Jaroszewicz J, Łapiński TW, Flisiak I, Prokopowiczi D. Effect of pegylated interferon alpha 2b plus ribavirin treatment on plasma transforming growth factor-β1, metalloproteinase-1, and tissue metalloproteinase inhibitor-1 in patients with chronic hepatitis C. World J Gastroenterol 2005; 11(43): 6833-6838
- URL: https://www.wjgnet.com/1007-9327/full/v11/i43/6833.htm
- DOI: https://dx.doi.org/10.3748/wjg.v11.i43.6833


