Copyright
©2005 Baishideng Publishing Group Inc.
World J Gastroenterol. Nov 21, 2005; 11(43): 6735-6739
Published online Nov 21, 2005. doi: 10.3748/wjg.v11.i43.6735
Published online Nov 21, 2005. doi: 10.3748/wjg.v11.i43.6735
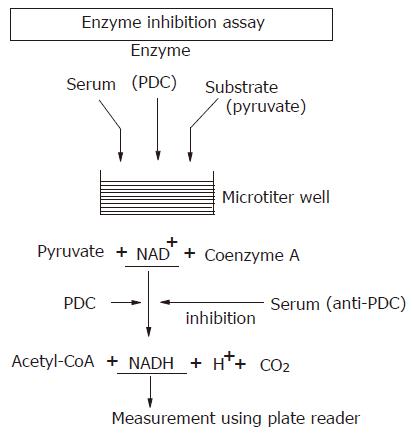
Figure 1 Principle of enzyme inhibition assay.
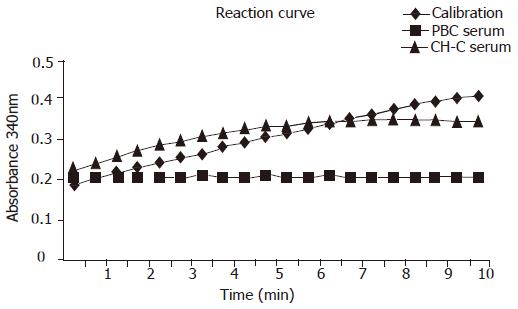
Figure 2 Representative reaction curve of automated enzyme inhibition assay using TRACE enzymatic mitochondrial antibody (M2) assay (EMA) kit.
PBC; primary biliary cirrhosis, CH-C; chronic hepatitis C.
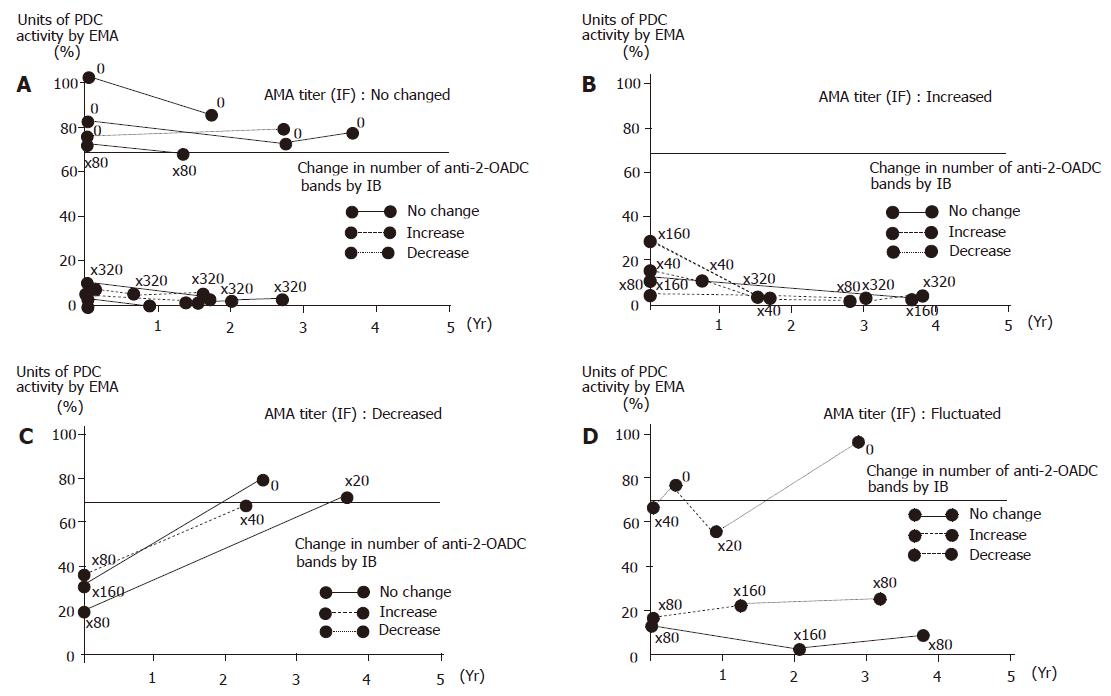
Figure 3 The units of pyruvate dehydrogenase complex (PDC) activity by enzymatic mitochondrial antibody (M2) assay (EMA) did not significantly vary in all the 9 patients in whom the titer of antimitochondrial antibodies (AMA) by immunofluorescence (IF) did not change during the course of follow-up.
However, the number of anti-2-oxo-acid dehydrogenase complex (anti-2-OADC) bands by immunoblotting (IB) changed in 4 of these patients (2 increased and 2 decreased) (A). The units of PDC activity by EMA decreased in all 4 patients whose AMA titers by IF had increased, but the number of anti-2-OADC bands by IB did not change in 1 patient (B). The units of PDC activity by EMA increased in all 3 patients in whom AMA titers by IF had decreased, but the number of anti-2-OADC bands by IB in these patients did not decrease (C). Of the 3 patients in whom AMA titers by IF showed some fluctuation, one showed fluctuation in the units of PDC activity by EMA and two showed fluctuation in the number of anti-2-OADC bands by IB (D).
- Citation: Omagari K, Hazama H, Kohno S. Enzyme inhibition assay for pyruvate dehydrogenase complex: Clinical utility for the diagnosis of primary biliary cirrhosis. World J Gastroenterol 2005; 11(43): 6735-6739
- URL: https://www.wjgnet.com/1007-9327/full/v11/i43/6735.htm
- DOI: https://dx.doi.org/10.3748/wjg.v11.i43.6735


