Copyright
©2005 Baishideng Publishing Group Inc.
World J Gastroenterol. Oct 28, 2005; 11(40): 6322-6329
Published online Oct 28, 2005. doi: 10.3748/wjg.v11.i40.6322
Published online Oct 28, 2005. doi: 10.3748/wjg.v11.i40.6322
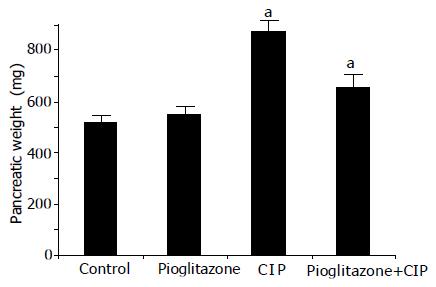
Figure 1 Pancreatic weight in rats with or without CIP pretreated with saline or pioglitazone at a dose 50 mg/kg.
Mean±SE of eight rats in each experimental group. Asterisk indicates a significant change as compared to the value in rats infused with saline. Cross indicates a significant change as compared to rats with CIP alone. aP<0.05 vs CIP alone.
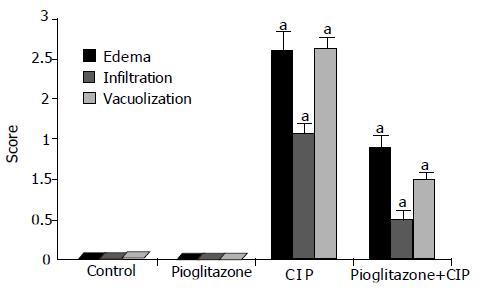
Figure 2 Histological changes (edema, infiltration, and vacuolization) observed in rats with or without CIP and pretreated with saline or pioglitazone at a dose 50 mg/kg.
Mean±SE of eight rats in each experimental group. Asterisk indicates a significant change as compared to the value in rats infused with saline. Cross indicates a significant change as compared to rats with CIP alone.aP<0.05 vs CIP alone.
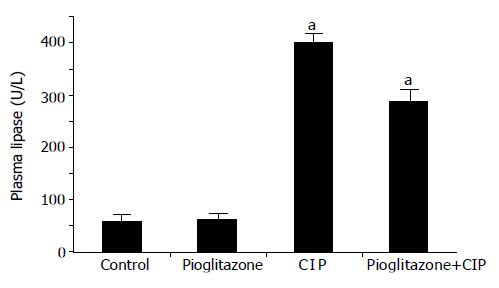
Figure 3 Plasma lipase activity in rats with or without CIP and pretreated with saline or pioglitazone at a dose 50 mg/kg.
Mean±SE of eight rats in each experimental group. Asterisk indicates a significant change as compared to the value in rats infused with saline. Cross indicates a significant change as compared to rats with CIP alone. aP<0.05 vs CIP alone.
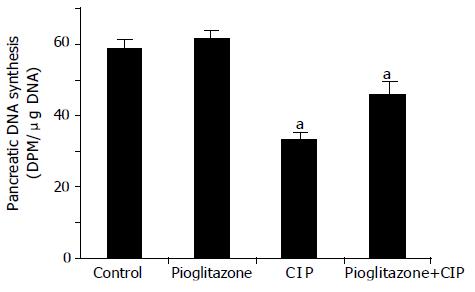
Figure 4 Pancreatic DNA synthesis in rats with or without CIP and pretreated with saline or pioglitazone at a dose 50 mg/kg.
Mean±SE of eight rats in each experimental group. Asterisk indicates a significant change as compared to the value in rats infused with saline. Cross indicates a significant change as compared to rats with CIP alone. aP<0.05 vs CIP alone.
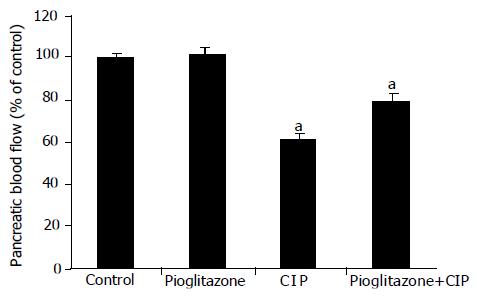
Figure 5 Pancreatic blood flow in rats with or without CIP and pretreated with saline or pioglitazone at a dose 50 mg/kg.
Mean±SE of eight rats in each experimental group. Asterisk indicates a significant change as compared to the value in rats infused with saline. Cross indicates a significant change as compared to rats with CIP alone.aP<0.05 vs CIP alone.
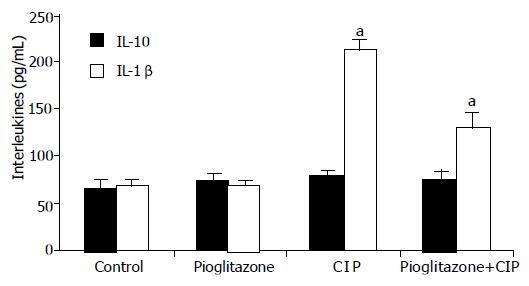
Figure 6 Plasma IL-1b and IL-10 levels in rats with or without CIP and pretreated with saline or pioglitazone at a dose 50 mg/kg.
Mean±SE of eight rats in each experimental group. Asterisk indicates a significant change as compared to the value in rats infused with saline. Cross indicates a significant change as compared to rats with CIP alone.aP<0.05 vs CIP alone.
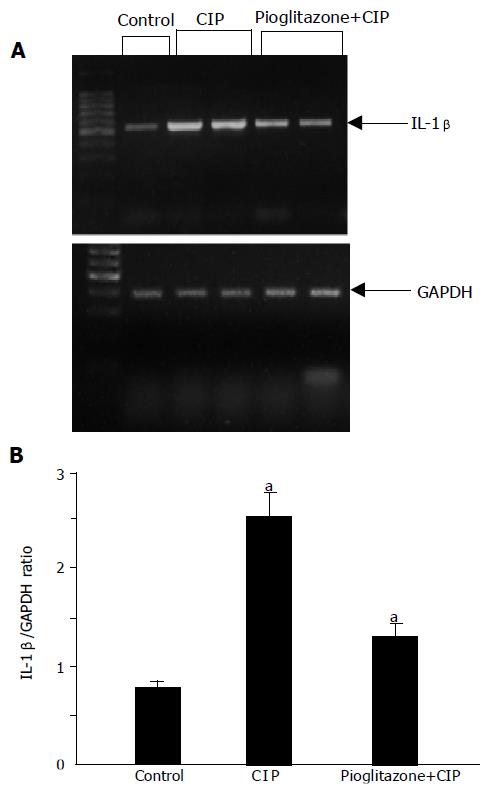
Figure 7 Expression of IL-1b mRNA and densitometric analysis of IL-1b mRNA expression (IL-1b/GAPDH ratio) in rats infused with saline without pancreatitis (control), rats with CIP and rats with CIP pretreated with pioglitazone.
(A,B) Asterisk indicates a significant change as compared to the value in rats infused with saline. Cross indicates a significant change as compared to rats with CIP alone.aP<0.05 vs CIP alone.
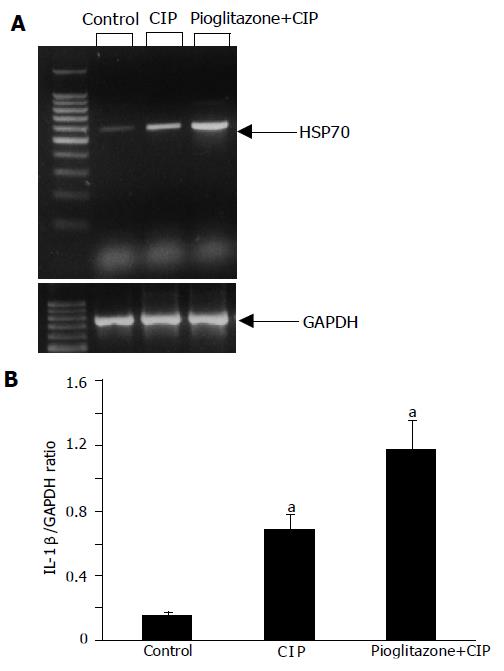
Figure 8 Expression of HSP70 mRNA and densitometric analysis of HSP70 mRNA expression (HSP70/GAPDH ratio) in rats infused with saline without pancreatitis (control), rats with CIP and rats with CIP pretreated with pioglitazone.
(A,B) Asterisk indicates a significant change as compared to the value in rats infused with saline. Cross indicates a significant change as compared to rats with CIP alone.aP<0.05 vs CIP alone.
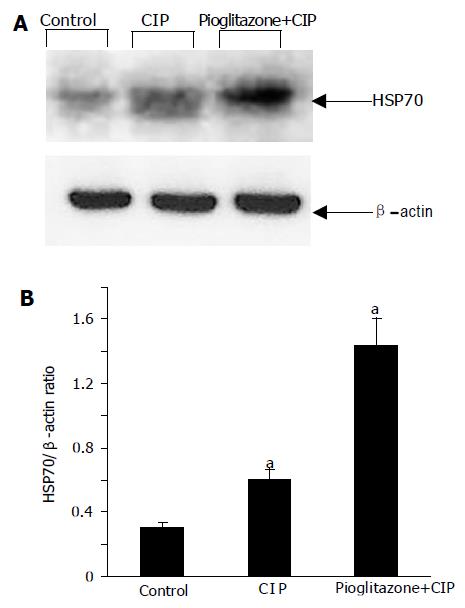
Figure 9 Expression of HSP70 protein and densitometric analysis of HSP70 protein expression (HSP70/b-actin ratio) in rats infused with saline without pancreatitis (control), rats with CIP and rats with CIP pretreated with pioglitazone.
(A,B) Asterisk indicates a significant change as compared to the value in rats infused with saline. Cross indicates a significant change as compared to rats with CIP alone.aP<0.05 vs CIP alone.
- Citation: Konturek PC, Dembinski A, Warzecha Z, Burnat G, Ceranowicz P, Hahn EG, Dembinski M, Tomaszewska R, Konturek SJ. Pioglitazone, a specific ligand of peroxisome proliferator-activated receptor-gamma, protects pancreas against acute cerulein-induced pancreatitis. World J Gastroenterol 2005; 11(40): 6322-6329
- URL: https://www.wjgnet.com/1007-9327/full/v11/i40/6322.htm
- DOI: https://dx.doi.org/10.3748/wjg.v11.i40.6322


