Copyright
©2005 Baishideng Publishing Group Inc.
World J Gastroenterol. Oct 28, 2005; 11(40): 6295-6304
Published online Oct 28, 2005. doi: 10.3748/wjg.v11.i40.6295
Published online Oct 28, 2005. doi: 10.3748/wjg.v11.i40.6295
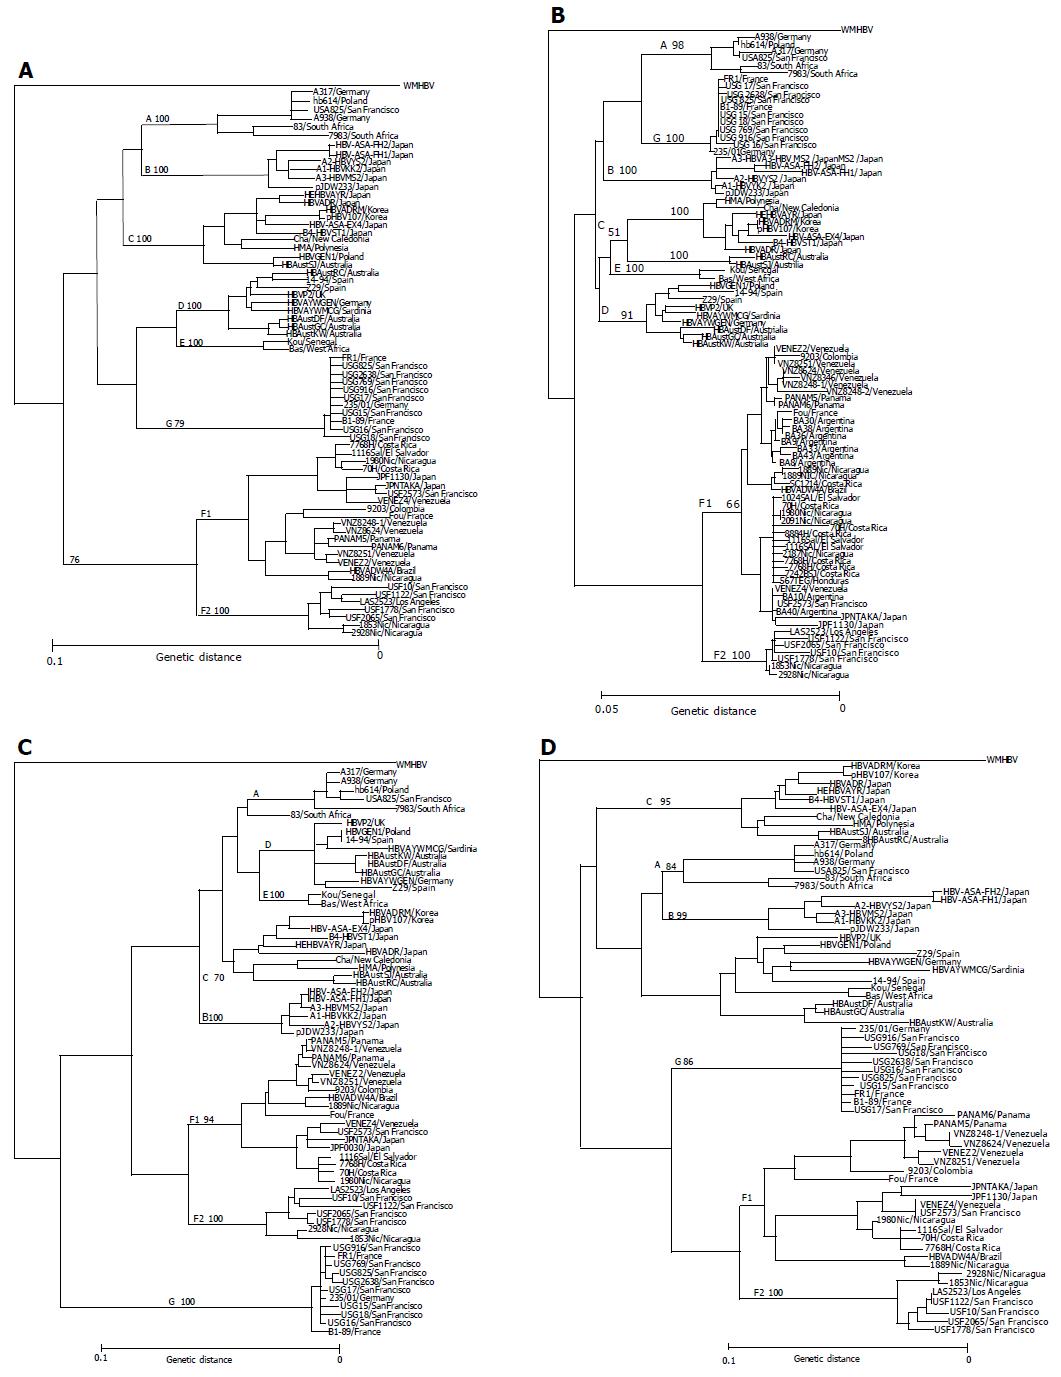
Figure 1 Phylogenetic trees constructed by HBV isolates of the major seven genotypes (A-G) on the full-genome (A), S gene (B), X gene (C) and core gene (D).
Each tree includes 11 HBV/F isolates identified in this study as well as 59 HBV isolates retrieved from Database, and an additional 22 HBV/F isolates (shown as boldface) joined in the phylogenetic tree of the S region. Confidence values calculated by bootstrap analysis are indicated as a suffix to each genotype.
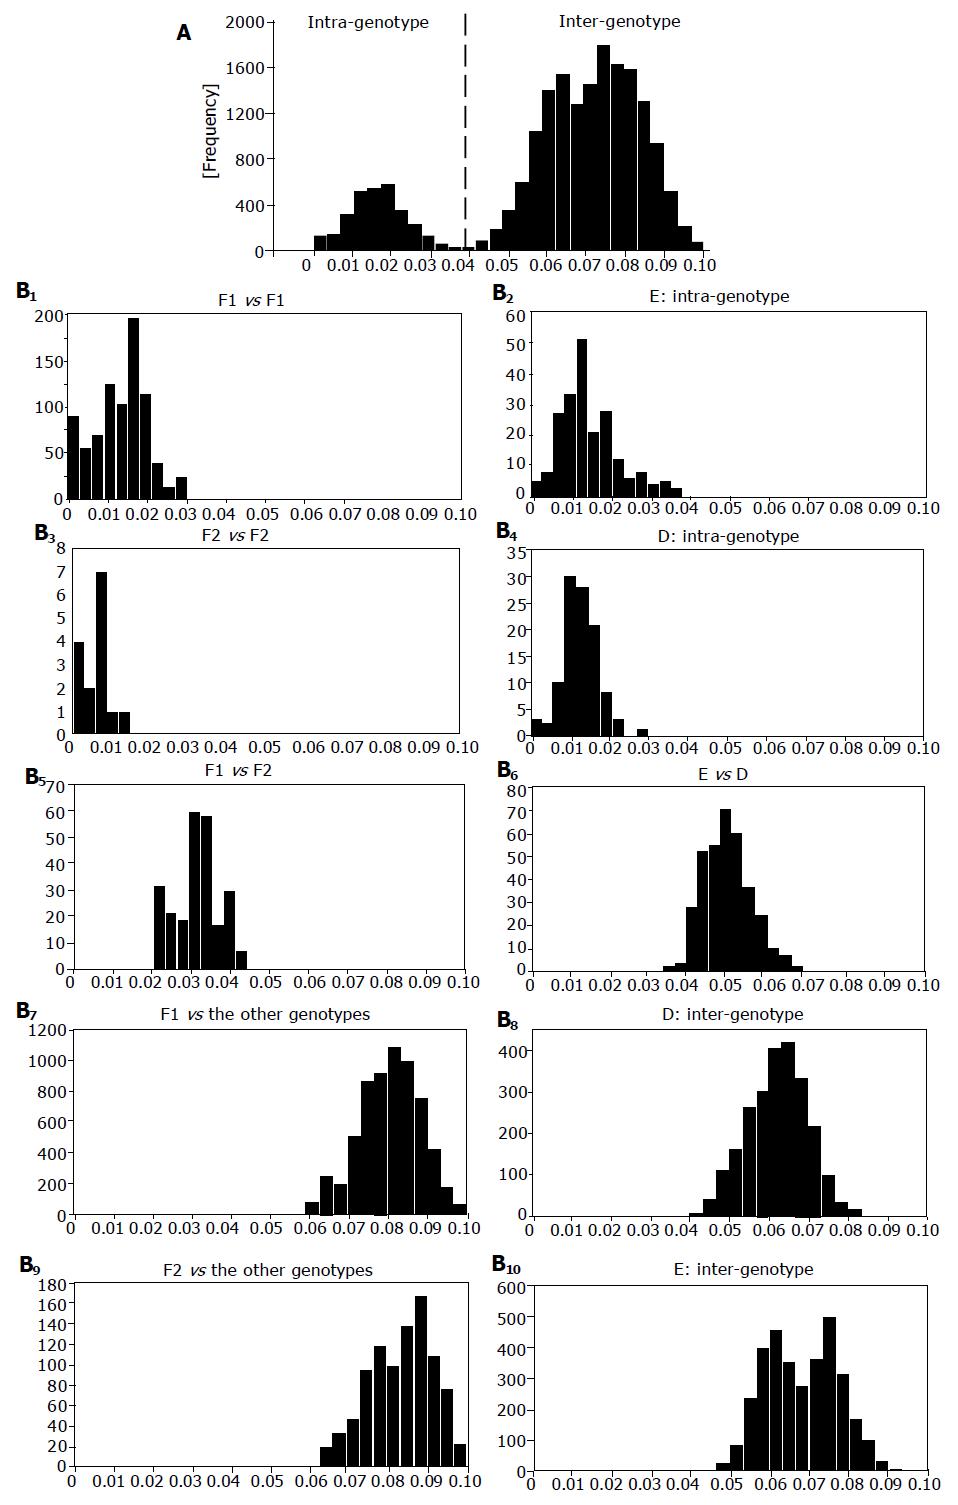
Figure 2 Pair-wise comparison of S-gene sequences.
Distribution of genetic distance among HBV isolates of all genotypes (A) and that of HBV/F1, HBV/F2, HBV/D, HBV/E, each other and among themselves (B1-10). Joined in comparison were seven HBV/F2 isolates, 47 HBV/F1 isolates and 136 HBV isolates of the other genotypes. X-axis and y-axis indicate genetic distance and frequency, respectively.
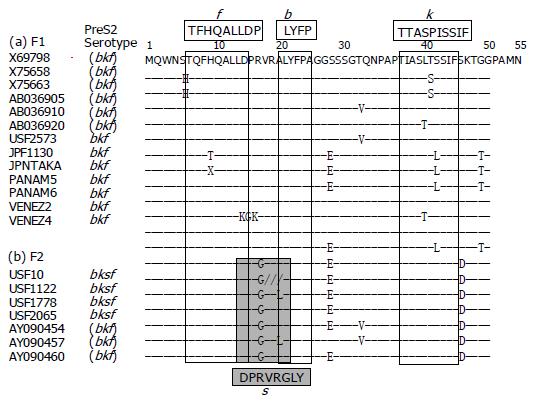
Figure 3 Amino acid sequences of the product of preS2 region of HBV/F isolates.
Sequences are shown for the 13 HBV/F isolates of F1 subtype and the 7 of F2 subtype. Epitopes recognized by monoclonal antibodies, used for ELISA for the determination of serotypes[5,6], are shown above and below the nucleotide sequences in columns.
- Citation: Kato H, Fujiwara K, Gish RG, Sakugawa H, Yoshizawa H, Sugauchi F, Orito E, Ueda R, Tanaka Y, Kato T, Miyakawa Y, Mizokami M. Classifying genotype F of hepatitis B virus into F1 and F2 subtypes. World J Gastroenterol 2005; 11(40): 6295-6304
- URL: https://www.wjgnet.com/1007-9327/full/v11/i40/6295.htm
- DOI: https://dx.doi.org/10.3748/wjg.v11.i40.6295


