Copyright
©The Author(s) 2005.
World J Gastroenterol. Oct 21, 2005; 11(39): 6176-6181
Published online Oct 21, 2005. doi: 10.3748/wjg.v11.i39.6176
Published online Oct 21, 2005. doi: 10.3748/wjg.v11.i39.6176
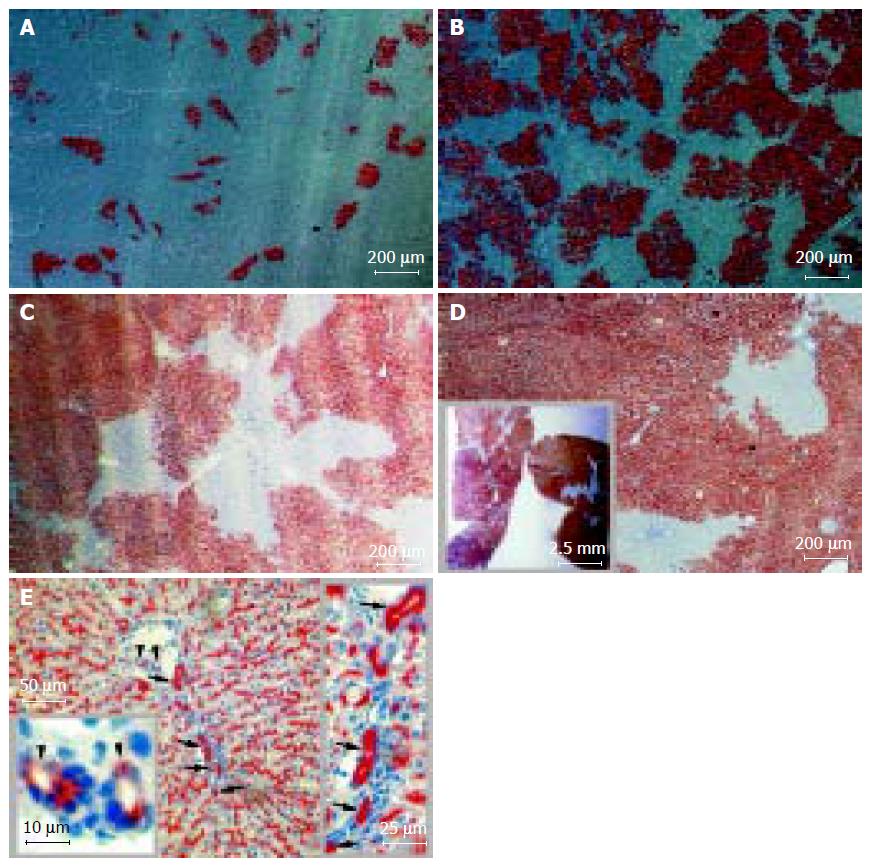
Figure 1 Long-term liver repopulation 1-20 mo after hepatocellular Tx and hepatic epithelial reconstitution from donor hepatocytes.
Recipient DPPIV-deficient Fischer rats were treated with retrorsine and subjected to two-thirds PH. DPPIV-positive donor hepatocytes were infused through the portal vein. 2?06 donor cells per recipient in A-C and 1?06 in D and E. Cryostat sections show DPPIV-positive cells as red-brown after histochemical staining. Data presented as mean± SD from three to six individuals in two or three independent experiments. Tx: transplantation; DPPIV: dipeptidyl peptidase IV. A: 1-mo repopulation: 14.8?.2%; polarization contrast image; B: 2-mo repopulation: 50.7?3.9%; polarization contrast image; C: 3-mo repopulation: 70.4?.0% with hematoxylin counterstaining; D: 20-mo repopulation: 89.8?.7% with hematoxylin counterstaining. The inset box displays the cross-sections of hepatic lobes under stereomicroscopy and E: DPPIV-positive cells not only were expressed in parenchyma but also were found in Hering抯 canal-like structures (arrow) and interlobular bile duct-like structure (arrowhead) in recipient liver; hematoxylin counterstaining.
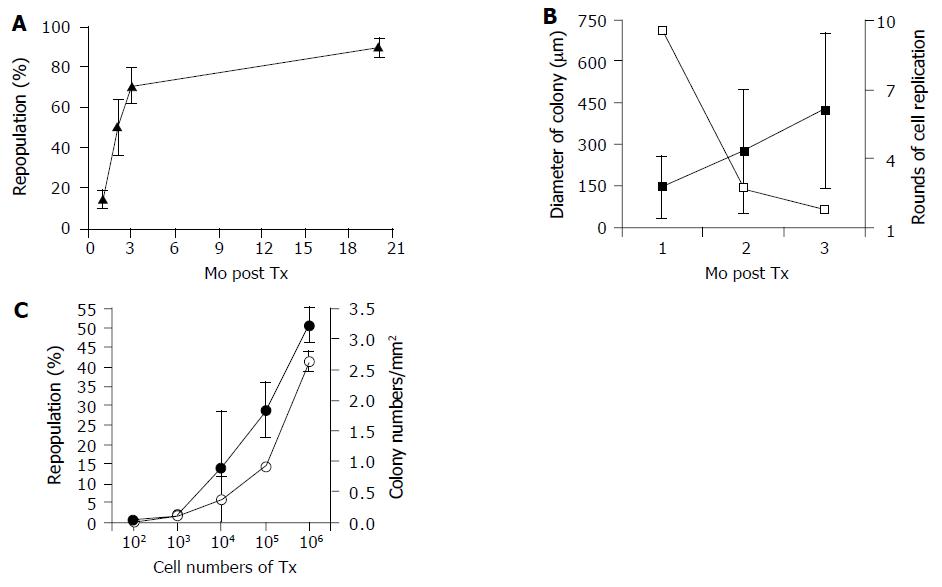
Figure 2 Repopulation kinetics of hepatocellular Tx.
DPPIV+ donor hepatocytes were isolated and infused into DPPIV-deficient rats through the portal vein. The visualized DPPIV+ cells in recipient were processed by a computer-aided analysis. Data are presented as mean± SD from three to six individuals in two or three independent experiments. Tx: transplantation; DPPIV: dipeptidyl peptidase IV. A: Kinetics of liver repopulation. Transplanted cell numbers into 1-3 mo and 20 mo were 2?06 and 1?06, respectively. The repopulation rate increased dramatically over 3 mo and reached a plateau at 20 mo; B: Kinetics of colony size and cell replication. Transplanted cell numbers into 1-2 mo and 3 mo were 2?06 and 1?06, respectively. The estimation technique of cell replication rounds is explained in Results. The average colony size from donor hepatocytes in the 3 mo after Tx are filled squares and the estimated number of rounds of cell replication are open squares and C: Cell-dose effect on liver repopulation and colony numbers. All samples collected at 3 mo after Tx and the repopulation rate (filled circles) and colony numbers (open circles) showed a similar trend.
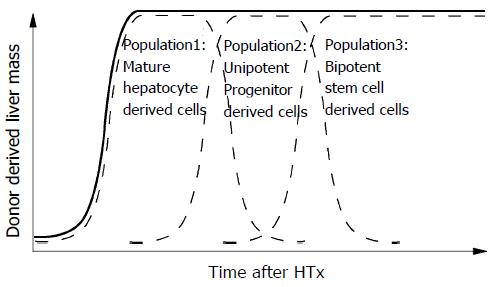
Figure 3 Schematic diagram of long-term repopulation after HTx.
Different cell populations may be required for different phases of liver regeneration/repopulation. The solid lines express the repopulation of donor-derived cells in the liver and the broken lines are the repopulation from the possible contributors. This assumes a heterogeneous population of transplanted hepatocytes. HTx: hepatocellular transplantation.
- Citation: Zheng YW, Ohkohchi N, Taniguchi H. Quantitative evaluation of long-term liver repopulation and the reconstitution of bile ductules after hepatocellular transplantation. World J Gastroenterol 2005; 11(39): 6176-6181
- URL: https://www.wjgnet.com/1007-9327/full/v11/i39/6176.htm
- DOI: https://dx.doi.org/10.3748/wjg.v11.i39.6176


