Copyright
©The Author(s) 2005.
World J Gastroenterol. Oct 21, 2005; 11(39): 6115-6119
Published online Oct 21, 2005. doi: 10.3748/wjg.v11.i39.6115
Published online Oct 21, 2005. doi: 10.3748/wjg.v11.i39.6115
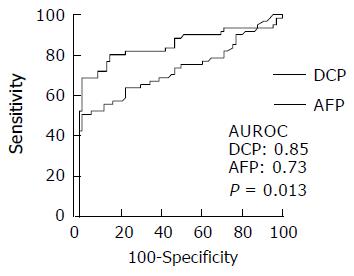
Figure 1 AUROC curves comparing DCP and AFP in patients with HCC and those with nonmalignant liver disease.
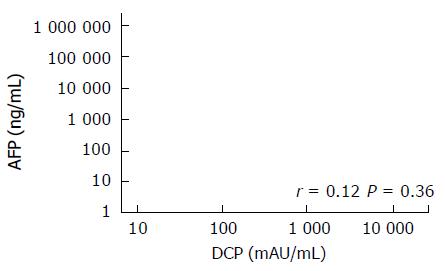
Figure 2 Relationship between DCP and AFP levels in 61 patients with HCC.
Figure 3 Box plot for DCP and AFP values in relation to size of tumor in 39 patients with solitary HCC (group 1, tumor less than 2 cm; group 2, tumor between 2 and 3 cm; and group 3, tumor more than 3 cm).
The data were presented as the median and the range from the 25th-75th percentile(A and B).
- Citation: Wang CS, Lin CL, Lee HC, Chen KY, Chiang MF, Chen HS, Lin TJ, Liao LY. Usefulness of serum des-γ-carboxy prothrombin in detection of hepatocellular carcinoma. World J Gastroenterol 2005; 11(39): 6115-6119
- URL: https://www.wjgnet.com/1007-9327/full/v11/i39/6115.htm
- DOI: https://dx.doi.org/10.3748/wjg.v11.i39.6115


