Copyright
©The Author(s) 2005.
World J Gastroenterol. Oct 14, 2005; 11(38): 5993-5996
Published online Oct 14, 2005. doi: 10.3748/wjg.v11.i38.5993
Published online Oct 14, 2005. doi: 10.3748/wjg.v11.i38.5993
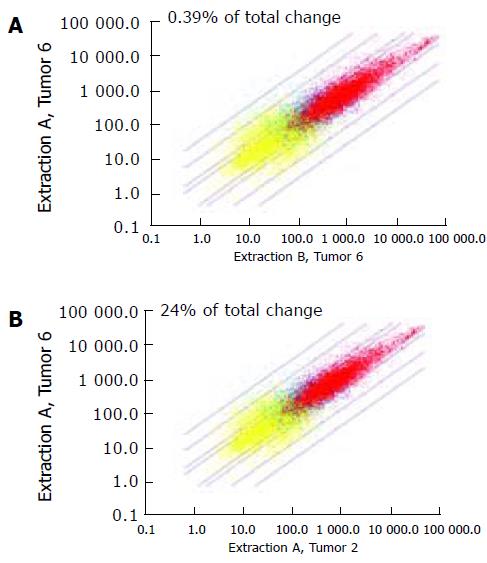
Figure 1 Scatter plots of the expression profiles derived from two different regions of the same gastric cancer sample (extraction A vs extraction B from tumor no.
6) (B) and from two different gastric cancer samples (extraction A from tumor no. 6 vs extraction A from tumor no. 2). The solid lines indicate 2-, 3-, 10-, and 30-fold expression level differences. Red dots represent gene transcripts detected in both arrays, yellow dots represent gene transcripts undetectable in both arrays, and blue dots represent transcripts detectable in one but undetectable in the other array. Gene transcripts detectable in both arrays (red dots) show a high correlation and thus a low percentage of "total change" for two different regions of the same tumor sample (B), whereas they show a poor correlation and thus a high percentage of "total change" for fragments of different tumors (A).
- Citation: Trautmann K, Steudel C, Grossmann D, Aust D, Ehninger G, Miehlke S, Thiede C. Expression profiling of gastric cancer samples by oligonucleotide microarray analysis reveals low degree of intra-tumor variability. World J Gastroenterol 2005; 11(38): 5993-5996
- URL: https://www.wjgnet.com/1007-9327/full/v11/i38/5993.htm
- DOI: https://dx.doi.org/10.3748/wjg.v11.i38.5993


