Copyright
©The Author(s) 2005.
World J Gastroenterol. Oct 14, 2005; 11(38): 5988-5992
Published online Oct 14, 2005. doi: 10.3748/wjg.v11.i38.5988
Published online Oct 14, 2005. doi: 10.3748/wjg.v11.i38.5988
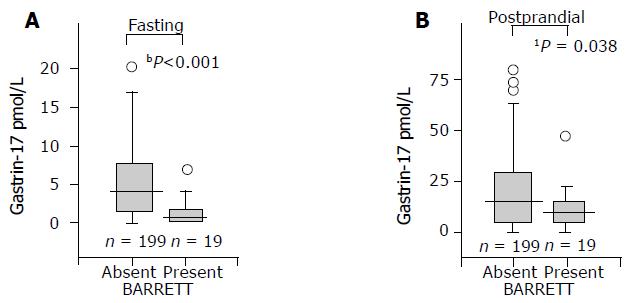
Figure 1 Fasting (A) and postprandial (B) serum G-17 levels in patients with or without long-segment BE in the whole study population.
A box plot presentation. The boxes show the central 50% of the cases. The length of the box shows the range within which the center 50% of the values fell. The whiskers show the range of values that fall within 1.5 difference of the values of median from the two hinges of the box. Differences: a: P<0.001; b: P=0.038; non-parametric test (MannWhitney U). To make the figure clear, the very most extreme outliers are not shown in the pictures.
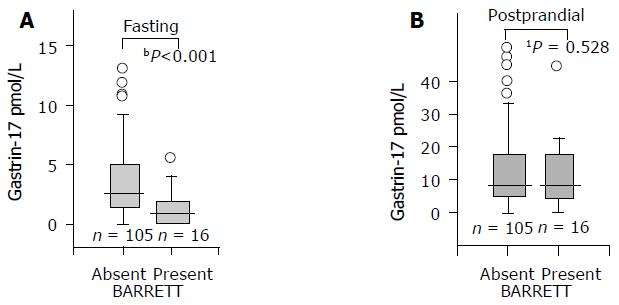
Figure 2 Fasting (A) and postprandial (B) serum G-17 levels in patients with or without long-segment BE among patients and controls with normal and healthy stomach mucosae (no gastritis, no H.
pylori, and no atrophy). A box plot presentation (see Figure 1). Differences: a: P<0.001; b: P=0.528; non-parametric test (MannWhitney U). To make the figure clear, the very most extreme outliers are not shown in the pictures.
- Citation: Sipponen P, Vauhkonen M, Helske T, Kääriäinen I, Härkönen M. Low circulating levels of gastrin-17 in patients with Barrett's esophagus. World J Gastroenterol 2005; 11(38): 5988-5992
- URL: https://www.wjgnet.com/1007-9327/full/v11/i38/5988.htm
- DOI: https://dx.doi.org/10.3748/wjg.v11.i38.5988


