Copyright
©The Author(s) 2005.
World J Gastroenterol. Oct 14, 2005; 11(38): 5915-5919
Published online Oct 14, 2005. doi: 10.3748/wjg.v11.i38.5915
Published online Oct 14, 2005. doi: 10.3748/wjg.v11.i38.5915
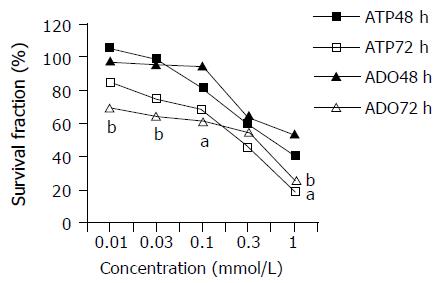
Figure 1 Effects of various concentrations of ATP or ADO on survival fraction of TE-13 cells.
aP<0.05, bP<0.01 vs 48 h groups.
Figure 2 Effects of ATP (A) and ADO (B) on cell cycle of TE-13 cells (n = 3).
aP<0.05, bP<0.01 vs 0 mmol/L.
Figure 3 Fluorescence micrographs of TE-13 cells incubated for 48 h without treatment (A) and treated with ATP (B) or ADO(C) (×400).
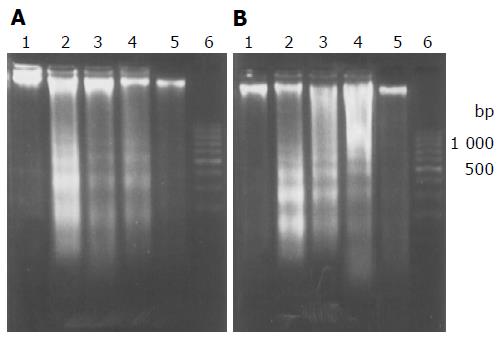
Figure 4 Agarose gel electrophoresis of DNA extracted from apoptotic TE-13 cells treated with ATP (A) or ADO (B) for 72 h.
Lane 1: control; lanes 2-5: 1, 0.3, 0.1, and 0.03 mmol/L, respectively; lane 6: marker.
Figure 5 ATP- or ADO-induced apoptosis of TE-13 cells detected by flow cytometry in control (A) and treated with ADO (B) and ATP (C) for 48 h, respectively.
- Citation: Wang MX, Ren LM, Shan BE. Inhibitory effects of extracellular adenosine triphosphate on growth of esophageal carcinoma cells. World J Gastroenterol 2005; 11(38): 5915-5919
- URL: https://www.wjgnet.com/1007-9327/full/v11/i38/5915.htm
- DOI: https://dx.doi.org/10.3748/wjg.v11.i38.5915


