Copyright
©The Author(s) 2005.
World J Gastroenterol. Sep 28, 2005; 11(36): 5725-5731
Published online Sep 28, 2005. doi: 10.3748/wjg.v11.i36.5725
Published online Sep 28, 2005. doi: 10.3748/wjg.v11.i36.5725
Figure 1 The heating site of LSTS.
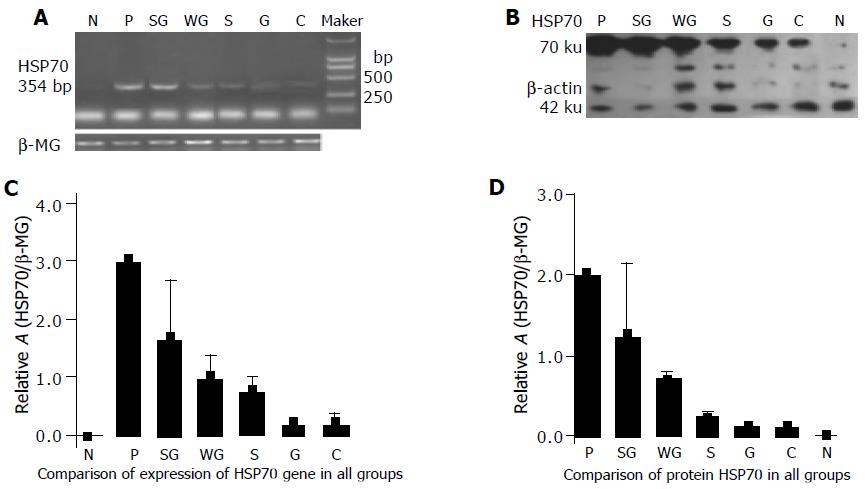
Figure 2 Detection of HSP70.
A, B, The expression of HSP70 gene detected by RT-PCR is shown. C, D, The production of HSP70 protein detected by Westem blotting is shown. P, positive control. N, nagetive control. SG WG G S C N, group name. The mean difference is significant compared with group G and C at the 0.05 level. The mean difference is significant compared with group S at the 0.05 level.
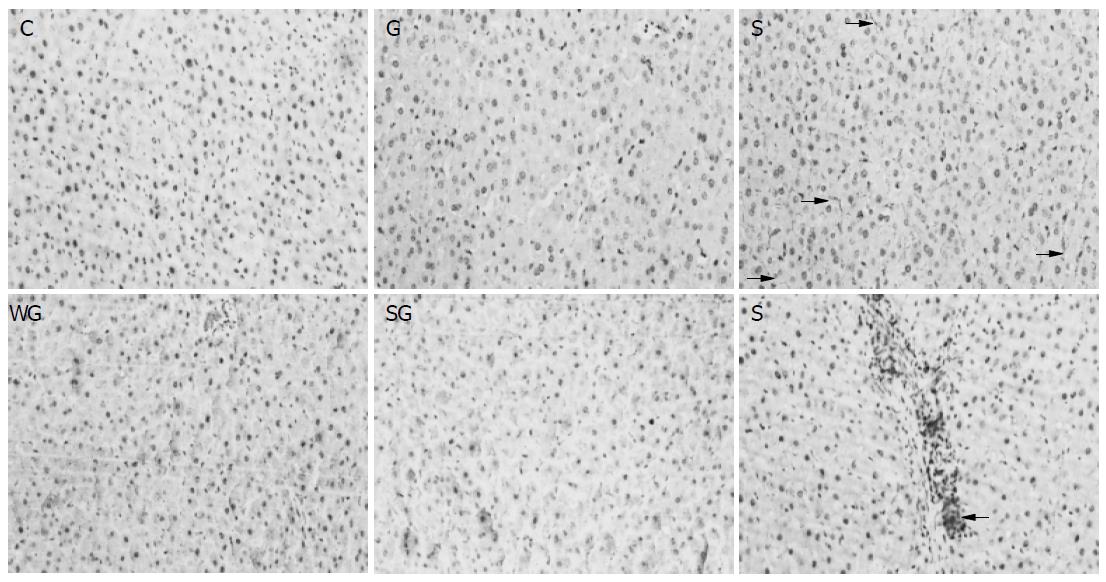
Figure 3 Immunohistochemical staining of HSP70 in liver tissue in group C,G, sinusoid (→) and periportal areas (←).
S,WG and SG HSP70-positive cells in group S were located in the hepatic
- Citation: Fan N, Yang GS, Lu JH, Yang N, Zhang HB. Oral administration of geranylgeranylacetone plus local somatothermal stimulation: A simple, effective, safe and operable preconditioning combination for conferring tolerance against ischemia-reperfusion injury in rat livers. World J Gastroenterol 2005; 11(36): 5725-5731
- URL: https://www.wjgnet.com/1007-9327/full/v11/i36/5725.htm
- DOI: https://dx.doi.org/10.3748/wjg.v11.i36.5725


