Copyright
©The Author(s) 2005.
World J Gastroenterol. Sep 28, 2005; 11(36): 5607-5613
Published online Sep 28, 2005. doi: 10.3748/wjg.v11.i36.5607
Published online Sep 28, 2005. doi: 10.3748/wjg.v11.i36.5607
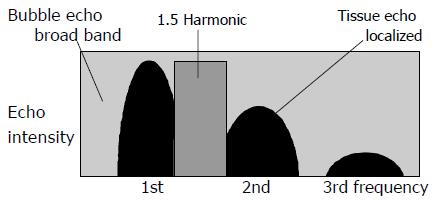
Figure 1 Basic concept of 1.
5 Harmonic Imaging Sonography. A high microbubble/ tissue ratio is obtained in the intermediate domain.
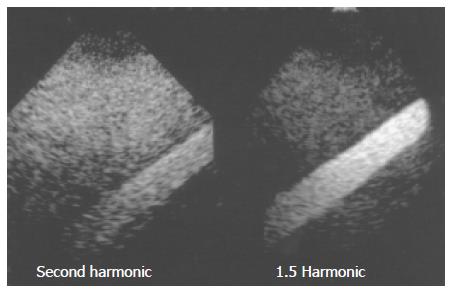
Figure 2 Comparison of contrast images obtained by 1.
5 Harmonic Imaging Sonography and 2nd harmonic imaging.
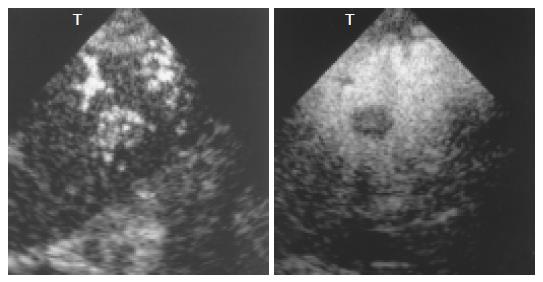
Figure 3 A 74-year-old man with C-type cirrhosis and HCC (15.
4 mm in diameter) in the right liver. Comparison of contrast images obtained by 1.5 Harmonic Imaging Sonography and 2nd harmonic imaging. A: 1.5 Harmonic Imaging Sonography image obtained by real-time continuous sonography in the early phase (20 s after injection). Abundant tumor vessels (arrows) with peripheral branching are seen; B: 1.5 Harmonic Imaging Sonography image obtained by real- time continuous sonography in the late phase (5 min after injection). Residual enhancement of some tumor vessels is seen, but the boundary between the tumor and the hepatic parenchyma is clearly demonstrated; C: 2nd harmonic imaging obtained by real- time continuous sonography in the early phase (20 s after injection). The abundant and peripherally branching tumor vessels (arrows) cannot be clearly depicted; D: 2nd harmonic imaging obtained by real-time continuous sonography in the late phase (5 min after injection). The boundary between the tumor and the hepatic parenchyma is somewhat obscure.
Figure 4 A 78-year-old man with C-type cirrhosis and HCC (73.
3 mm in diameter) in the right liver. A: Right oblique conventional sonography image of the liver shows a mixed-pattern nodule 73.3 mm in diameter in segment 6 that exhibits the typical characteristics of HCC; B: 1.5 Harmonic Imaging Sonography image obtained by real-time continuous sonography in the early phase (20 s after injection) shows the tumor vessels; C and D: 1.5 Harmonic Imaging Sonography images obtained by real-time continuous sonography in the early phase, 28 s (C) and 32 s (D) after injection, show abundant tumor vessels with peripheral branching.
Figure 5 A 62-year-old man with C-type cirrhosis and HCC (18.
9 mm in diameter) in segment 4 of the liver. A: 1.5 Harmonic Imaging Sonography image obtained by real-time continuous sonography in the early phase (28 s after injection) shows abundant tumor vessels with peripheral branching; B: 1.5 Harmonic Imaging Sonography image obtained by real-time continuous sonography in the late phase (5 min after injection) shows residual enhancement of some tumor vessels, but the boundary between the tumor and the hepatic parenchyma is clearly depicted.
Figure 6 A 73-year- old man with C-type cirrhosis and HCC (16.
5 mm in diameter) in the right liver who had undergone transcatheter arterial chemoembolization therapy with iodized oil and an anticancer drug. A : Transverse CT image with iodized oil obtained 7 d after treatment shows incomplete retention of iodized oil within the nodule; B and C: 1.5 Harmonic Imaging Sonography images obtained 35 s (B) and 5 min (C) after injection show partial enhancement. Right oblique 1.5 Harmonic Imaging Sonography image depicts residual tumor vessels within the tumor and subcapsular area (arrows), which is suggestive of possible future recurrence in this region.
Figure 7 A 59-year- old woman with C-type cirrhosis and HCC (17.
7 mm in diameter) in the right liver who had undergone transcatheter arterial chemoembolization therapy with iodized oil and an anticancer drug. A: Transverse CT scan with iodized oil obtained 7 d after treatment shows incomplete retention of iodized oil within the nodule; B and C: 1.5 Harmonic Imaging Sonography images obtained 34 s (B) and 5 min (C) after injection show partial enhancement. Right oblique 1.5 Harmonic Imaging Sonography image depicts residual tumor vessels within the tumor and subcapsular area (arrows), which is suggestive of possible recurrence in this region.
- Citation: Yamamoto K, Shiraki K, Nakanishi S, Fuke H, Nakano T, Hashimoto A, Shimizu A, Hamataki T. 1.5 Harmonic Imaging Sonography with microbubble contrast agent improves characterization of hepatocellular carcinoma. World J Gastroenterol 2005; 11(36): 5607-5613
- URL: https://www.wjgnet.com/1007-9327/full/v11/i36/5607.htm
- DOI: https://dx.doi.org/10.3748/wjg.v11.i36.5607


