Copyright
©2005 Baishideng Publishing Group Inc.
World J Gastroenterol. Sep 21, 2005; 11(35): 5438-5443
Published online Sep 21, 2005. doi: 10.3748/wjg.v11.i35.5438
Published online Sep 21, 2005. doi: 10.3748/wjg.v11.i35.5438
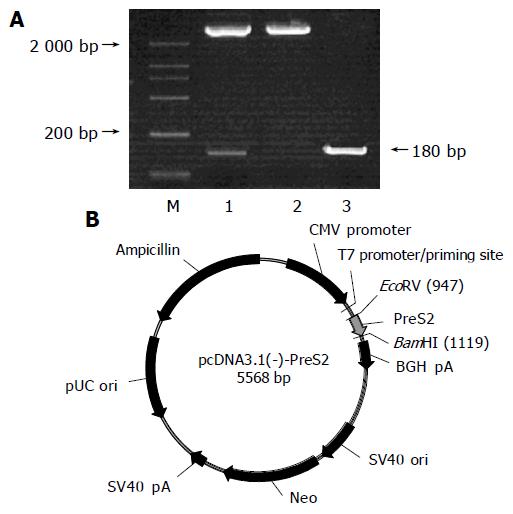
Figure 1 A: Products of pcDNA3.
1(-)-pre-S2 PCR and restriction enzyme cleaved were eletrophoresed in 2.0% agarose gel. Lane 1: EcoRV/BamHI cleaved, lane 2: PstI cleaved, lane 3: production of plasmid PCR, M: DNA marker (2 000 bp). B: Structure of expression plasmid pcDNA3.1(-)-pre-S2.
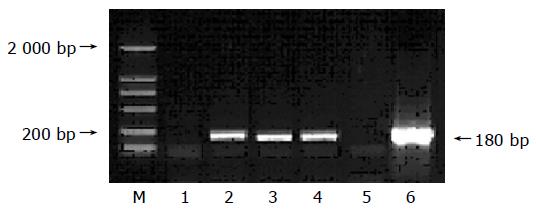
Figure 2 RT-PCR products were eletrophoresed in 0.
9% agarose gel. Lane 1:negative control, lanes 2-4: mRNA was isolated from pcDNA3.1(-)-pre-S2 and RT-PCR was performed by three different Oligod T, lane 5: blank control, lane 6: positive control, M: DNA marker (2 000 bp).
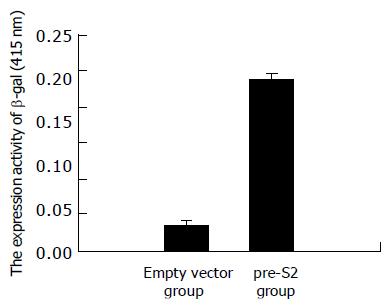
Figure 3 Result of b-galactosidase enzyme analysis.
The numbers represent mean±SD of 7 separate transfections.
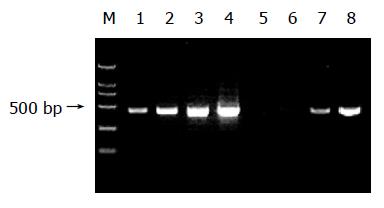
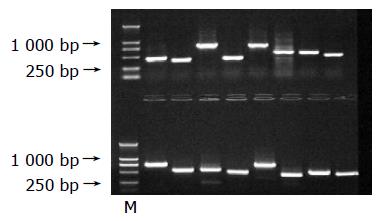
Figure 4 Reduction of G3PDH abundance by PCR-select subtraction.
PCR was performed on unsubtracted (lanes1-4) or subtracted (lanes 5-8) secondary PCR products with the G3PDH 5’ and 3’ primers. Lanes 1, 5: 18 cycles; lanes 2, 6: 23 cycles; lanes 3, 7: 28 cycles; lanes 4, 8: 33 cycles. Lane M: DNA marker (2 000 bp).
Figure 5 Results of PCR amplification of part clones (17-32).
M: DNA marker (2 000 bp).
- Citation: Ji D, Cheng J, Chen GF, Liu Y, Wang L, Guo J. Study of transactivating effect of pre-S2 protein of hepatitis B virus and cloning of genes transactivated by pre-S2 protein with suppression subtractive hybridization. World J Gastroenterol 2005; 11(35): 5438-5443
- URL: https://www.wjgnet.com/1007-9327/full/v11/i35/5438.htm
- DOI: https://dx.doi.org/10.3748/wjg.v11.i35.5438


