Copyright
©The Author(s) 2005.
World J Gastroenterol. Sep 14, 2005; 11(34): 5367-5372
Published online Sep 14, 2005. doi: 10.3748/wjg.v11.i34.5367
Published online Sep 14, 2005. doi: 10.3748/wjg.v11.i34.5367
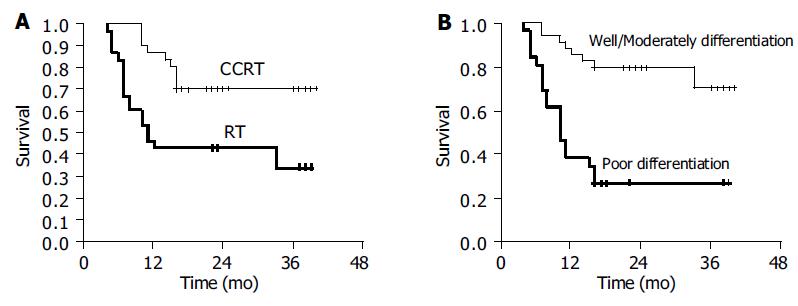
Figure 1 Kaplan-Meier curves for overall survival as a function of treatment group.
P value is 0.003 (A); Kaplan-Meier curves for overall survival as a function of squamous cell differentiation state (B).
- Citation: Liu HC, Hung SK, Huang CJ, Chen CC, Chen MJ, Chang CC, Tai CJ, Tzen CY, Lu LH, Chen YJ. Esophagectomy for locally advanced esophageal cancer, followed by chemoradiotherapy and adjuvant chemotherapy. World J Gastroenterol 2005; 11(34): 5367-5372
- URL: https://www.wjgnet.com/1007-9327/full/v11/i34/5367.htm
- DOI: https://dx.doi.org/10.3748/wjg.v11.i34.5367


