Copyright
©The Author(s) 2005.
World J Gastroenterol. Sep 14, 2005; 11(34): 5289-5294
Published online Sep 14, 2005. doi: 10.3748/wjg.v11.i34.5289
Published online Sep 14, 2005. doi: 10.3748/wjg.v11.i34.5289
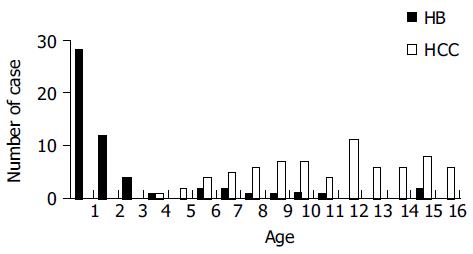
Figure 1 Age distribution of childhood hepatocellular carcinomas (HCC) and hepatoblastomas (HB).
Figure 2 Cumulative survival curves for patients with liver malignancies in each intergroup stage.
A: HCC (I vs III, P = 0.0011; III vs VI, P = 0.0002; log rank test); B: HB (I vs II, P = 0.0019; II vs III, P = 0.8783; III vs VI, P = 0.5365; log rank test).
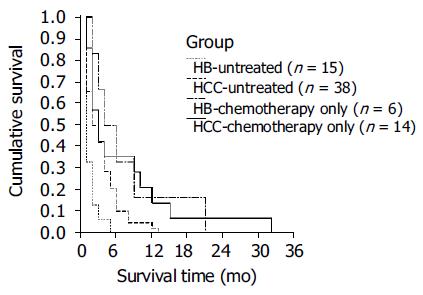
Figure 3 Cumulative survival curves for eventually unresected HCC and HB (stages III and IV).
HB-untreated compared poorly in survival with HB-chemotherapy only, HCC-untreated and HCC-chemotherapy only (P = 0.0015, 0.0040 and 0.0015; log rank test).
- Citation: Chen JC, Chang ML, Lin JN, Lai HS, Chen CC, Chen WJ, Hung WT. Comparison of childhood hepatic malignancies in a hepatitis B hyper-endemic area. World J Gastroenterol 2005; 11(34): 5289-5294
- URL: https://www.wjgnet.com/1007-9327/full/v11/i34/5289.htm
- DOI: https://dx.doi.org/10.3748/wjg.v11.i34.5289


