Copyright
©The Author(s) 2005.
World J Gastroenterol. Sep 7, 2005; 11(33): 5162-5168
Published online Sep 7, 2005. doi: 10.3748/wjg.v11.i33.5162
Published online Sep 7, 2005. doi: 10.3748/wjg.v11.i33.5162
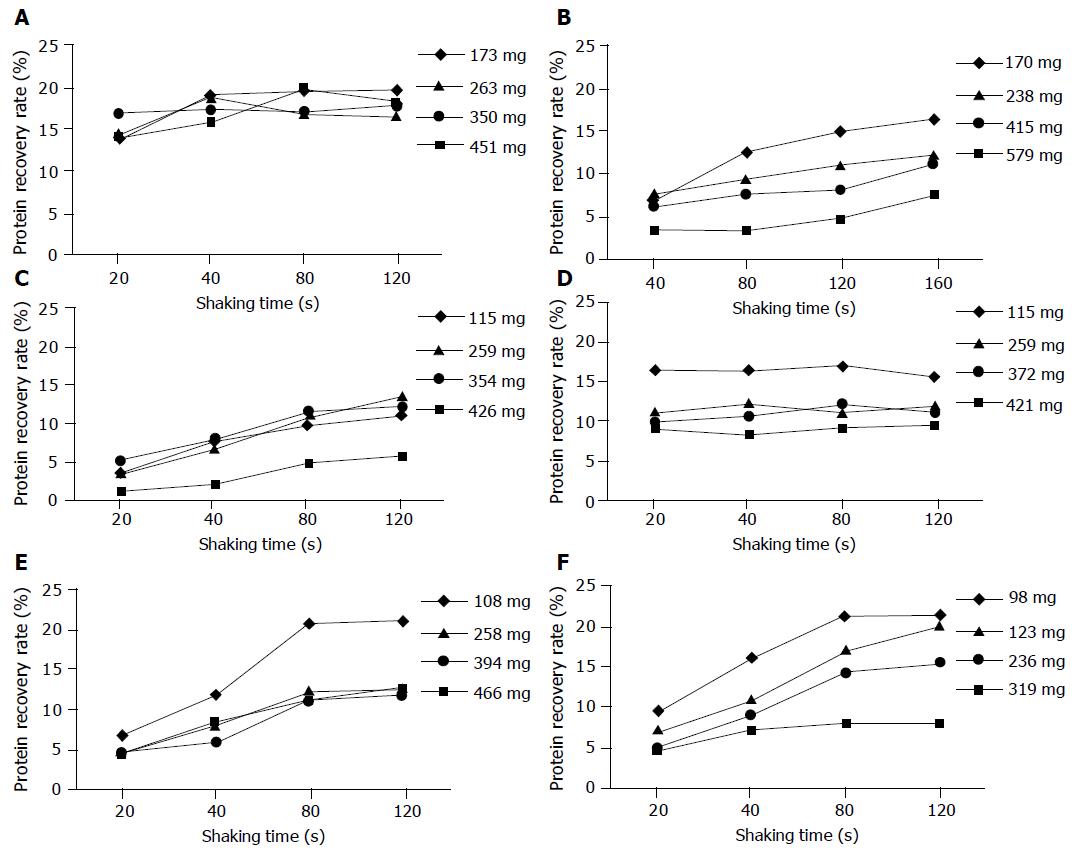
Figure 1 Determination of the optimal specimen size from different organs for tissue lysis by the MagNA Lyser.
Four specimen sizes, ranging from 100 to 600 mg, of rat organs were tested for the protein recovery rates from the new tissue lysis method using the MagNA Lyser. The oscillation frequency and duration was set at 6 500 r/min for 20, 40, 80, 120, or 180 s as indicated. Protein concentrations of tissue lysates were assayed by the Lowry method. The protein recovery rate from tissue lysis was calculated as the amount of total protein obtained divided by the original weight of the specimen. A: Liver; B: Stomach; C: Colon; D: Kidney; E: Spleen; F: Heart.
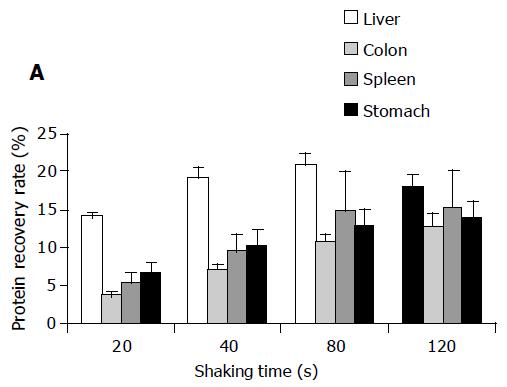
Figure 2 Determination of the optimal shaking time for tissue lysis by the MagNA Lyser.
Tissue pieces in sizes ranging from 150 to 200 mg were subjected to reciprocal oscillation by the MagNA Lyser at 6 500 r/min for different time periods. Protein concentrations of tissue lysates were assayed, and protein recovery rates were calculated as above. Additionally, an aliquot (200 mg) of each tissue lysate was resolved on a 7-cm IPG strip, pH 3-10, then run in an 8×9-cm 12% SDS-polyacrylamide gel, and visualized by AlphaImager 2000 after staining with Coomassie blue dye. The optimal shaking time for tissue lysis by MagNA Lyser was determined according to both the protein recovery rates (A) and the protein profiling from 2D gel electrophoresis (B).
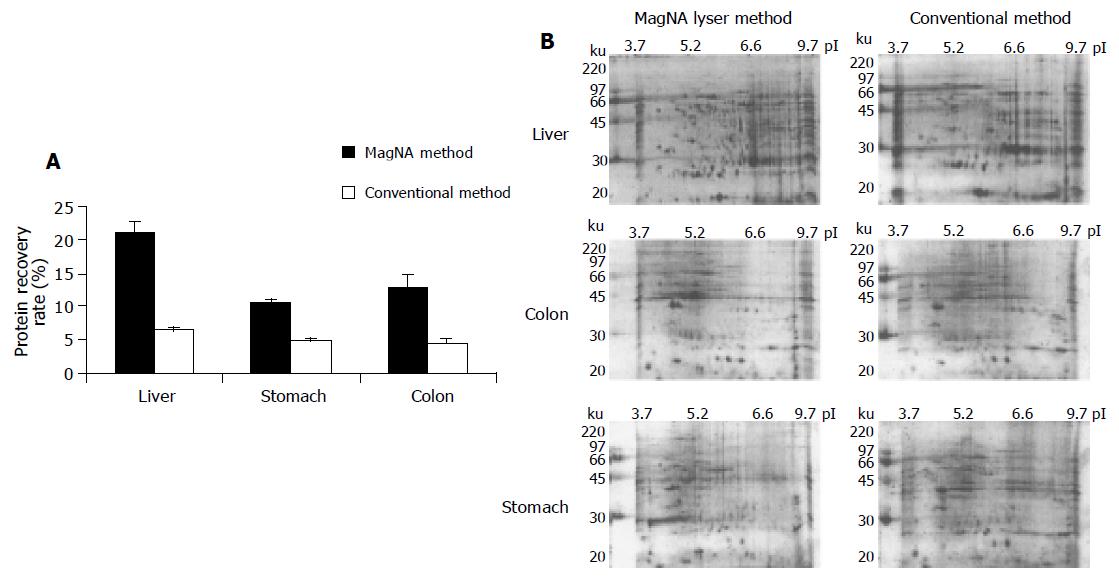
Figure 3 Comparison between conventional tissue lysis with the new method using MagNA Lyser.
Tissue specimens ranging from 150 to 200 mg in size were processed using the conventional tissue lysis protocol and the new MagNA Lyser method. The protein recovery rates (A) and 2D gel profiling (B) were compared for the two methods.
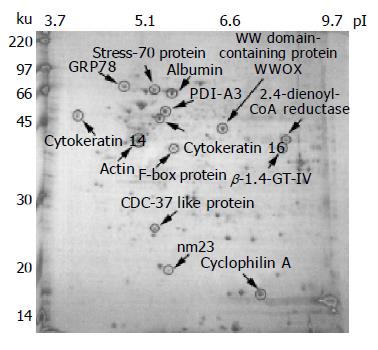
Figure 4 Proteomic analysis of the human colorectal cancer tissue lysate prepared by the MagNA Lyser.
Approximately 150 mg of tumor specimen from a colon cancer patient was subjected to tissue lysis by the new MagNA Lyser method. One aliquot (600 mg) of tissue lysate was resolved on a 13-cm IPG strip, pH 3-10, and subsequently run in a 14 cm×15 cm 12% SDS-polyacrylamide gel, then visualized by staining with Coomassie blue dye. Protein spots were cut from the gel, after trypsin digestion and peptide extraction, the spots were identified through MALDI-TOF mass spectrometry, and have been labeled on the gel image.
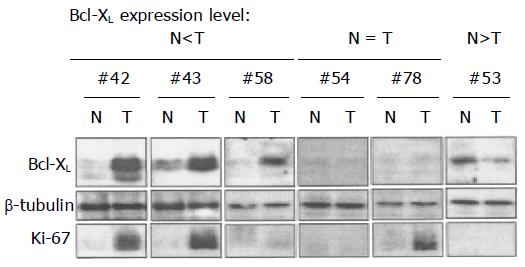
Figure 5 Differential expression levels of Bcl-XL in colorectal cancer tissue specimens.
Immunoblot analyses were performed to analyze the protein levels of Bcl-XL in the lysates from nontumor tissues (N) and tumor tissues (T) of colorectal cancer patient #42, #43, #53, #54, #58, and #78. The levels of b-tubulin in the same-paired tissue lysates were analyzed as internal control.
- Citation: Chen WS, Chang HY, Chang JT, Liu JM, Li CP, Chen LL, Chang HL, Chen CC, Huang TS. Novel rapid tissue lysis method to evaluate cancer proteins: Correlation between elevated Bcl-XL expression and colorectal cancer cell proliferation. World J Gastroenterol 2005; 11(33): 5162-5168
- URL: https://www.wjgnet.com/1007-9327/full/v11/i33/5162.htm
- DOI: https://dx.doi.org/10.3748/wjg.v11.i33.5162


