Copyright
©The Author(s) 2005.
World J Gastroenterol. Aug 28, 2005; 11(32): 5010-5014
Published online Aug 28, 2005. doi: 10.3748/wjg.v11.i32.5010
Published online Aug 28, 2005. doi: 10.3748/wjg.v11.i32.5010
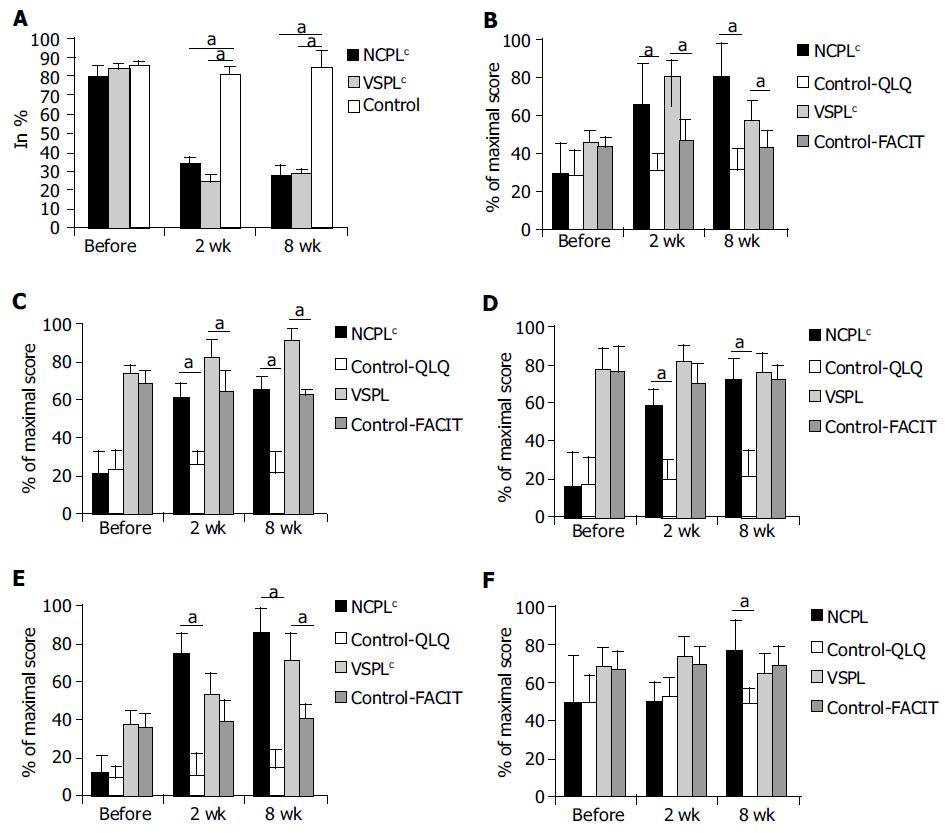
Figure 1 Results of pain and quality of life assessment in CP patients and controls.
A: VAS-Pain; B: Physical well-being; C: Emotional well-being; D:Social support; E: Fatigue; F: Ailments characteristic for the illness. aP<0.05 t-test vs NCPB or VSPL group and corresponding control; cP<0.05 vs paired ANOVA. Results are shown as mean±SD.
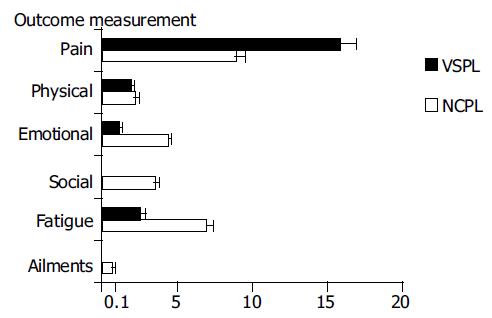
Figure 2 Effect of VSPL and NCPB on pain of CP patients and controls.
Bars show mean effect from two measurements.
- Citation: Basinski A, Stefaniak T, Vingerhoets A, Makarewicz W, Kaska L, Stanek A, Lachinski AJ, Sledzinski Z. Effect of NCPB and VSPL on pain and quality of life in chronic pancreatitis patients. World J Gastroenterol 2005; 11(32): 5010-5014
- URL: https://www.wjgnet.com/1007-9327/full/v11/i32/5010.htm
- DOI: https://dx.doi.org/10.3748/wjg.v11.i32.5010


