Copyright
©The Author(s) 2005.
World J Gastroenterol. Aug 28, 2005; 11(32): 4992-4996
Published online Aug 28, 2005. doi: 10.3748/wjg.v11.i32.4992
Published online Aug 28, 2005. doi: 10.3748/wjg.v11.i32.4992
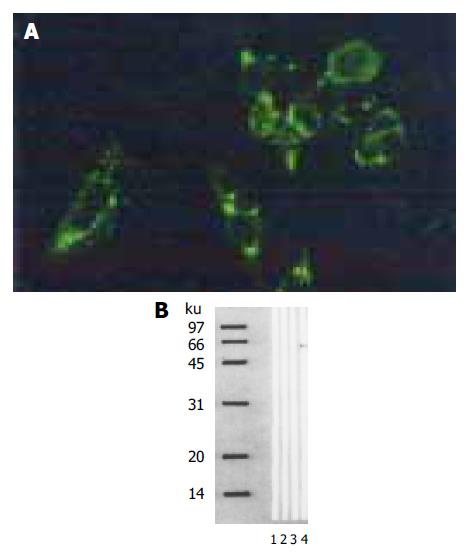
Figure 1 Angiostatin protein expression by immunofluorescence (A) Western blot analysis (B).
M: Marker; lane 1: PBScontrol; lane 2: PC-3; lane 3: PC-3pcDNA3.1(+); lane 4: PC-3/pcDNA3.1(+).
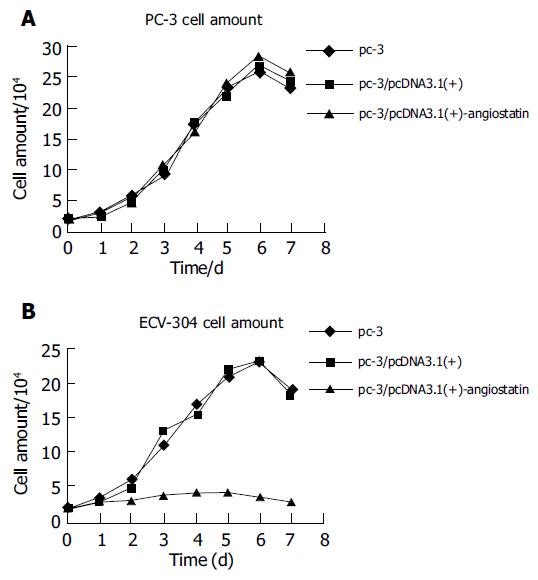
Figure 2 Cell growth curves of PC-3 (A) and ECV-304 (B).
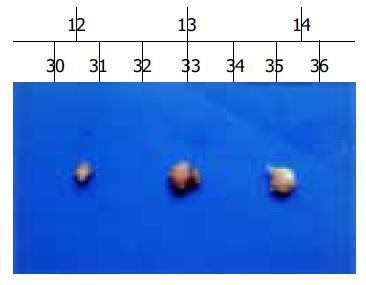
Figure 3 Tumors formed in nude mice by PC-3/pcDNA-angio, PC-3/pcDNA, and PC-3 cells (n = 5).
A: PC-3/pcDNA3.1(+)-angio; B: PC-3/pcDNA3.1(+); C: PC-3.
Figure 4 MVD in immunochemistry staining.
A: PC-3/pcDNA-angiostatin; B: PC-3/pcDNA3.1; C: PC-3. SP×200.
- Citation: Yang DZ, He J, Zhang JC, Wang ZR. Angiostatin inhibits pancreatic cancer cell proliferation and growth in nude mice. World J Gastroenterol 2005; 11(32): 4992-4996
- URL: https://www.wjgnet.com/1007-9327/full/v11/i32/4992.htm
- DOI: https://dx.doi.org/10.3748/wjg.v11.i32.4992


