Copyright
©The Author(s) 2005.
World J Gastroenterol. Aug 28, 2005; 11(32): 4957-4961
Published online Aug 28, 2005. doi: 10.3748/wjg.v11.i32.4957
Published online Aug 28, 2005. doi: 10.3748/wjg.v11.i32.4957
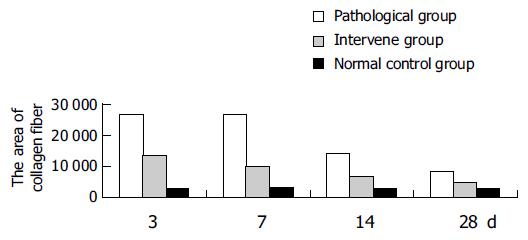
Figure 1 Area of collagen fiber at each time point during recovery of liver fibrosis.
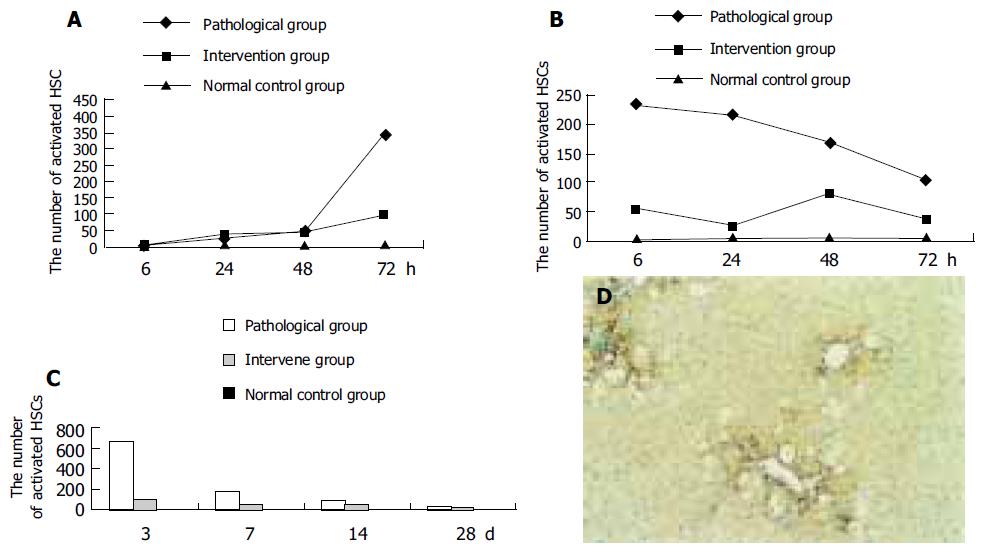
Figure 2 Change of activated HSCs after the first (A) and third (B) injection,during liver fibrosis recovery (C) and positive for a-SMA Immunohistochemistry staining (D).
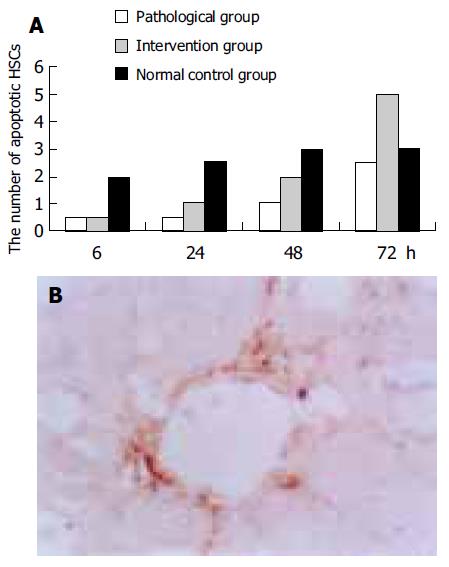
Figure 3 Apoptosis of activated HSCs after the first injection (A) and apoptotic HSCs positive for both TUNEL staining (violet) and a-SMA immunohistochemistry staining(brown) (B).
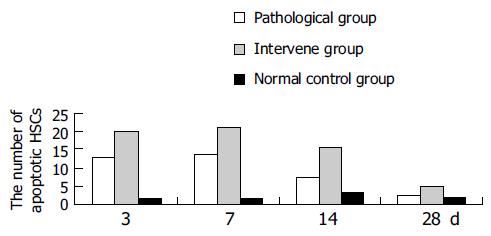
Figure 4 Number of apoptotic HSCs during recovery from liver fibrosis.
- Citation: Shen XH, Cheng WF, Li XH, Sun JQ, Li F, Ma L, Xie LM. Effects of dietary supplementation with vitamin E and selenium on rat hepatic stellate cell apoptosis. World J Gastroenterol 2005; 11(32): 4957-4961
- URL: https://www.wjgnet.com/1007-9327/full/v11/i32/4957.htm
- DOI: https://dx.doi.org/10.3748/wjg.v11.i32.4957


