Copyright
©The Author(s) 2005.
World J Gastroenterol. Jul 21, 2005; 11(27): 4199-4205
Published online Jul 21, 2005. doi: 10.3748/wjg.v11.i27.4199
Published online Jul 21, 2005. doi: 10.3748/wjg.v11.i27.4199
Figure 1 A: Liver function tests of patient 3 in the first month showing the strong increase of cholestasis followed by a milder rise of aminotransferases; B: Long-time course of AP (red) and ALT (black) of all patients showing the initial strong increase of AP with a subsequent slow decrease and only a mild initial rise of ALT with nearly normal values in the long term.
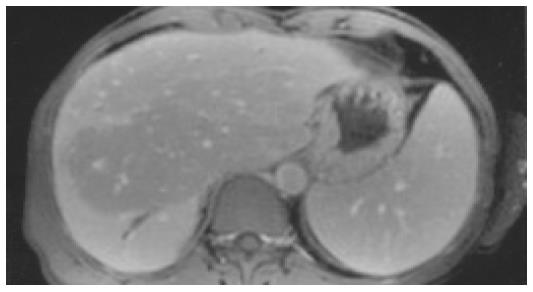
Figure 2 MRT of patient 2 (T1-weighted after contrast medium) showing an area centrally in the liver with reduced signal intensity, a dilatation of the bile duct in segment 6, and splenomegaly.
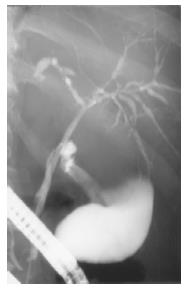
Figure 3 ERCP of patient 3 showing a normal cystic and common bile duct, but multifocal short strictures and dilatations of the intrahepatic bile ducts (4 mo after occurrence of cholestasis).
Figure 4 Liver histology of patient 4 (13 mo after occurrence of cholestasis).
A: Portal inflammation, severe cholestasis with bile thrombi, HE (20x); B: Lymphocytic infiltration of a small bile duct (arrow). Periodic acid Schiff’s reaction after treatment with diastase (100x); C: Immunostaining for cytokeratin 7. Regenerative bile duct proliferations show a strong expression of cytokeratin 7 (25x).
- Citation: Benninger J, Grobholz R, Oeztuerk Y, Antoni CH, Hahn EG, Singer MV, Strauss R. Sclerosing cholangitis following severe trauma: Description of a remarkable disease entity with emphasis on possible pathophysiologic mechanisms. World J Gastroenterol 2005; 11(27): 4199-4205
- URL: https://www.wjgnet.com/1007-9327/full/v11/i27/4199.htm
- DOI: https://dx.doi.org/10.3748/wjg.v11.i27.4199


