Copyright
©The Author(s) 2005.
World J Gastroenterol. Jul 21, 2005; 11(27): 4194-4198
Published online Jul 21, 2005. doi: 10.3748/wjg.v11.i27.4194
Published online Jul 21, 2005. doi: 10.3748/wjg.v11.i27.4194
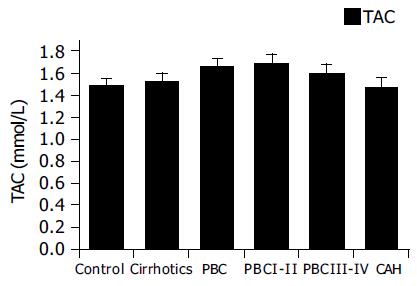
Figure 1 Total plasma antioxidant capacity in chronic liver diseases.
Slightly elevated TAC levels were found in PBC patients.
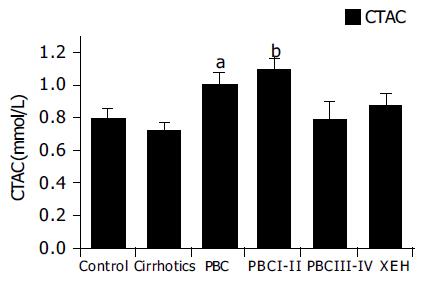
Figure 2 Corrected plasma antioxidant capacity in chronic liver diseases.
Increased levels of CTAC were found in PBC patients. Only early PBC patients (stages I and II) had high CTAC levels. aP < 0.05, bP < 0.01 vs controls.
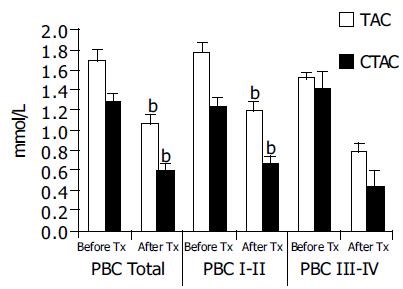
Figure 3 UDCA treatment reduces TAC and CTAC values.
A significant reduction of CTAC was observed in the early stages of PBC. In late stages, a reduction of CTAC was also noted but this was at the limit of statistical significance. bP < 0.001 vs TAC.
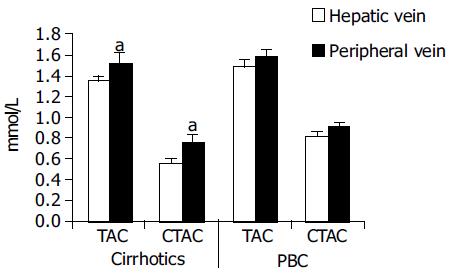
Figure 4 CTAC values are higher in peripheral blood samples compared to hepatic vein samples.
Hepatic vein samples had lower values of both TAC and CTAC compared to peripheral vein samples. This was significant only for the cirrhotic patients. In the treated PBC patients a similar trend was observed but it did not reach statistical significance. aP < 0.05 vs others.
- Citation: Notas G, Miliaraki N, Kampa M, Dimoulios F, Matrella E, Hatzidakis A, Castanas E, Kouroumalis E. Patients with primary biliary cirrhosis have increased serum total antioxidant capacity measured with the crocin bleaching assay. World J Gastroenterol 2005; 11(27): 4194-4198
- URL: https://www.wjgnet.com/1007-9327/full/v11/i27/4194.htm
- DOI: https://dx.doi.org/10.3748/wjg.v11.i27.4194


