Copyright
©The Author(s) 2005.
World J Gastroenterol. Jul 21, 2005; 11(27): 4173-4179
Published online Jul 21, 2005. doi: 10.3748/wjg.v11.i27.4173
Published online Jul 21, 2005. doi: 10.3748/wjg.v11.i27.4173
Figure 1 Effect of TMP on ion transport across rat colonic mucosa.
A: Representative recordings of ISC response to TMP (0.1, 1.0, 3.0, and 5.0 mmol/L) added to basolateral side. Arrowheads indicate the time of addition of TMP; B: Concentration-response curve of TMP with response indicated by the total charge transfer per unit area over a 30-min period. Each data point was obtained from at least four individual experiments. Values are mean±SE of maximal increase in ISC.
Figure 2 Ionic basis of TMP-induced ISC.
A: One millimole per liter of TMP-induced ISC response (total charge transfer per unit area over 30-min period) obtained in various solutions was plotted with normal KH solution as the control; B: Summarized data showing the effect of 1 mmol/L of TMP-evoked ISC response in the apical presence of amiloride (0.1 mmol/L), apical Na+ removal, and basolateral Na+ removal from the bath solution. Values are mean±SE; bP < 0.001, dP < 0.01 vs control. NS, not significant.
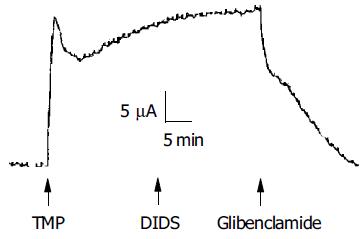
Figure 3 Effect of Cl- channel blockers.
Representative ISC recording with arrows indicating the response to TMP (5 mmol/L, basolateral) and apical addition of channel blockers DIDS (100 mmol/L) and glibenclamide (1 mmol/L).
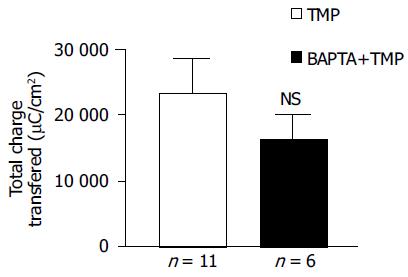
Figure 4 Effect of BAPTA-AM on TMP-evoked ISC.
Values are mean±SE; NS, not significant.
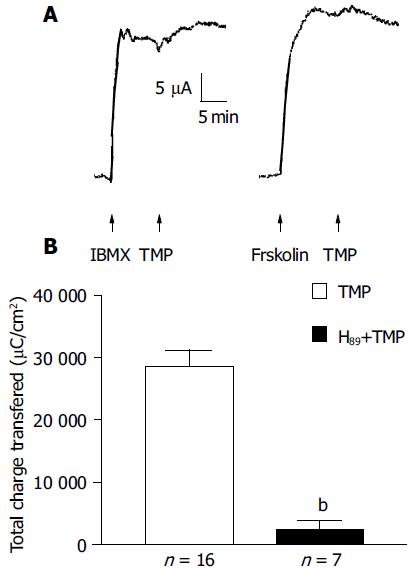
Figure 5 Involvement of cAMP in TMP-induced ISC response.
A: Representative recordings of ISC response to IBM× (100 µmol/L), forskolin (10 µmol/L) without additive effect observed upon subsequent challenge of TMP (1 mmol/L); B: Effect of H89 (5 µmol/L) on TMP (1 mmol/L)-induced ISC response. Values are mean±SE; bP < 0.001 vs control.
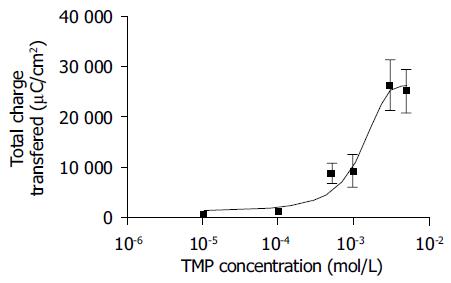
Figure 6 Concentration-response curve for TMP-induced transmembrane charges (30 min) in the presence of indomethacin (10 μmol/L).
Each data point was obtained from at least four individual experiments. Values are mean±SE of maximal increase in charge.
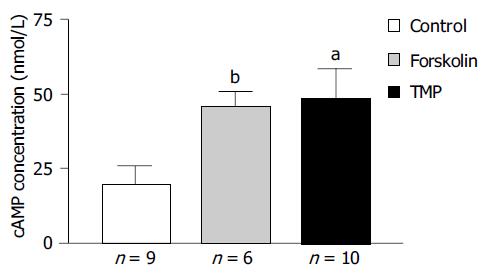
Figure 7 Effect of TMP on intracellular cAMP level.
Each column represents mean±SE; aP < 0.05, bP < 0.01 vs control (KHS).
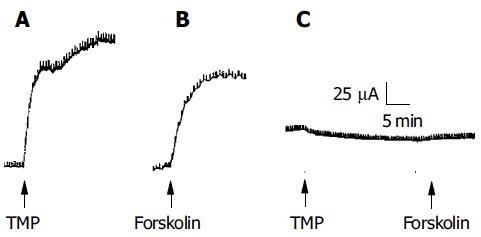
Figure 8 A-C: TMP-induced ISC response in colonic mucosa of mice with CFTR wild-type and homozygous mutation.
- Citation: He Q, Zhu JX, Xing Y, Tsang LL, Yang N, Rowlands DK, Chung YW, Chan HC. Tetramethylpyrazine stimulates cystic fibrosis transmembrane conductance regulator-mediated anion secretion in distal colon of rodents. World J Gastroenterol 2005; 11(27): 4173-4179
- URL: https://www.wjgnet.com/1007-9327/full/v11/i27/4173.htm
- DOI: https://dx.doi.org/10.3748/wjg.v11.i27.4173


