Copyright
©2005 Baishideng Publishing Group Inc.
World J Gastroenterol. Jun 28, 2005; 11(24): 3686-3690
Published online Jun 28, 2005. doi: 10.3748/wjg.v11.i24.3686
Published online Jun 28, 2005. doi: 10.3748/wjg.v11.i24.3686
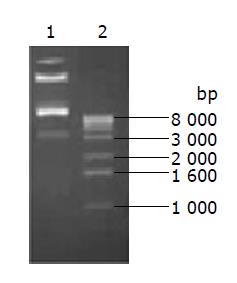
Figure 1 Restriction analysis of pAdtrackKDR-CDglyTK 1.
pAdtrackKDR-CDglyTK/(BglII+Xba1); 2. 1kb DNA ladder (products of Dingguo Biotechnology Development Center Co., Ltd.).
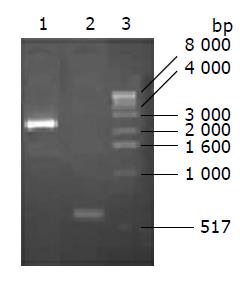
Figure 2 PCR amplification of CDglyTK and KDR promotor gene from the recombinant adenovirus DNA.
1. PCR products of the recombinant adenovirus DNA using the upstream and downstream primers of CDglyTK gene; 2. PCR products of the recombinant adenovirus DNA using the upstream and downstream primers of KDR promoter genes; 3. 1 kb DNA ladder (products of Dingguo Biotechnology Development Center Co., Ltd.).
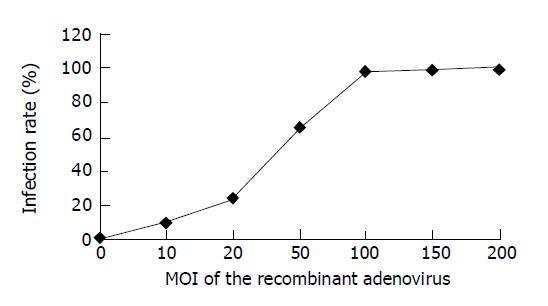
Figure 3 Infection rate of AdKDR-CDglyTK to HUVEC cells.
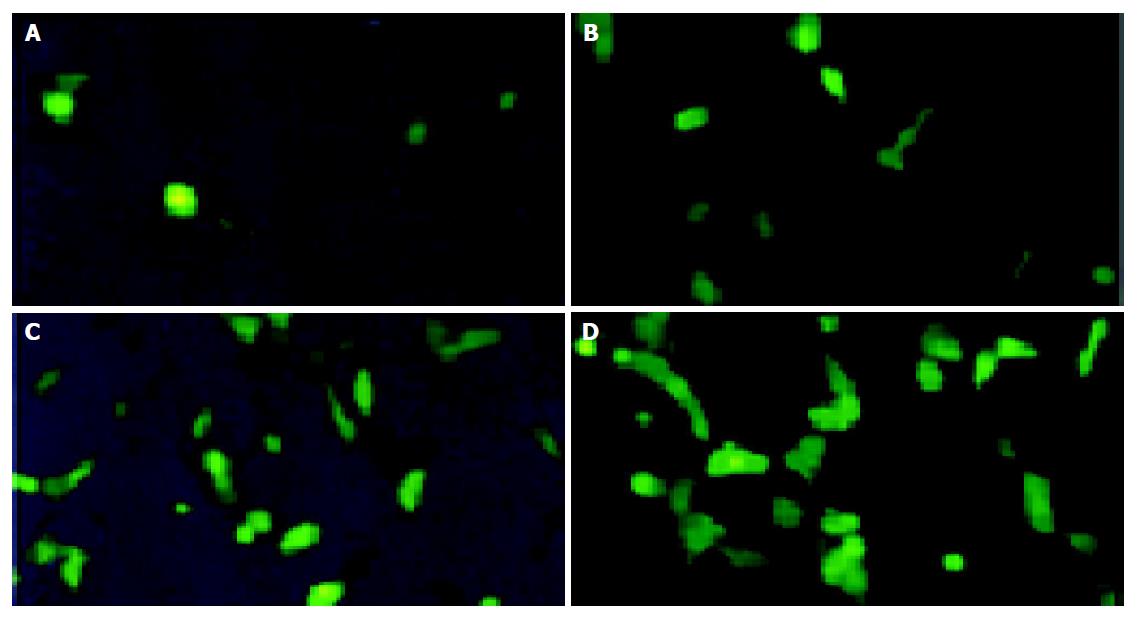
Figure 4 Recombinant adenovirus infected HUVEC cells GFP expression was visualized by fluorescence microscopy 3 d after HUVEC cells were infected with AdKDR-CdglyTK.
A-D: HUVEC cells infected with the recombinant adenoviruses at MOI of 1, 50, 100, and 200, respectively.
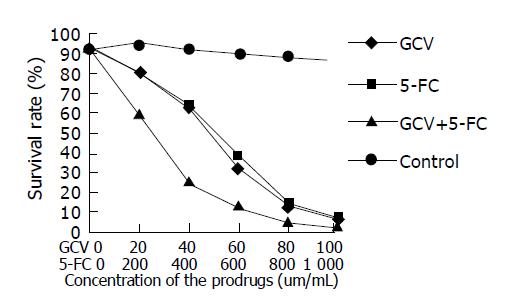
Figure 5 Survival rate of transgeneic cells after prodrug administration.
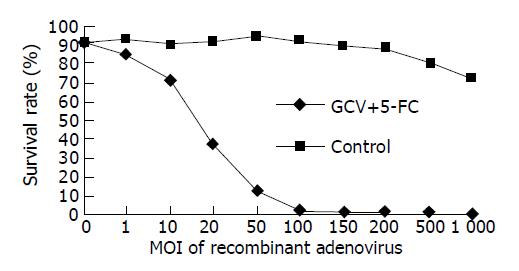
Figure 6 Influence of MOI of the recombinant viruses on the killing effect of prodrugs.
- Citation: Huang ZH, Yang WY, Cheng Q, Yu JL, Li Z, Tong ZY, Song HJ, Che XY. Kinase domain insert containing receptor promotor controlled suicide gene system kills human umbilical vein endothelial cells. World J Gastroenterol 2005; 11(24): 3686-3690
- URL: https://www.wjgnet.com/1007-9327/full/v11/i24/3686.htm
- DOI: https://dx.doi.org/10.3748/wjg.v11.i24.3686


