Copyright
©2005 Baishideng Publishing Group Inc.
World J Gastroenterol. Jun 7, 2005; 11(21): 3281-3284
Published online Jun 7, 2005. doi: 10.3748/wjg.v11.i21.3281
Published online Jun 7, 2005. doi: 10.3748/wjg.v11.i21.3281
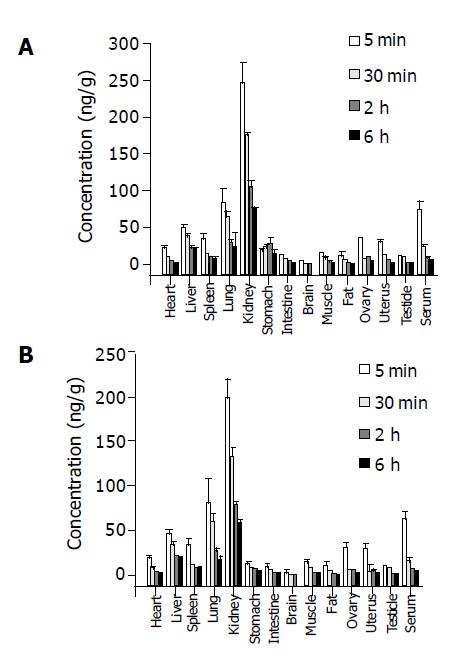
Figure 1 Tissue distribution of radioactivity of 125I-C-1027 (50 ìg/kg) after i.
v. injection to mice (n = 6). A: RA method; and B: TCA-RA method. Values were expressed as mean±SD.
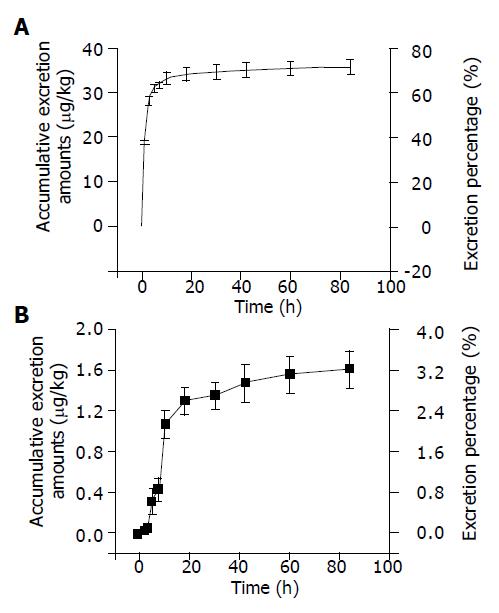
Figure 2 Excretion curves after iv.
injection of 125I-C-1027 (50 μg/kg) to mice by RA method (n = 6). A: excretion in urine; and B: excretion in feces. Values were expressed as mean±SD.
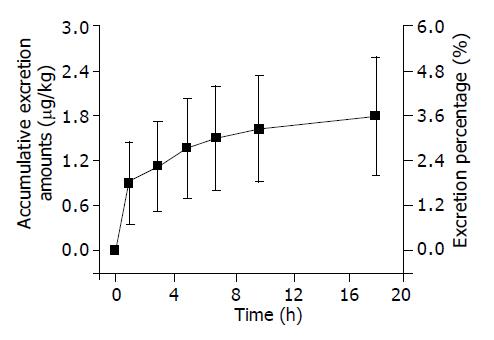
Figure 3 Bile excretion curve after i.
v. injection of 125I-C-1027 (50 μg/kg) to rats by RA method (n = 5). Values were expressed as mean±SD.
- Citation: Liu YP, Li QS, Huang YR, Liu CX. Tissue distribution and excretion of 125I-lidamycin in mice and rats. World J Gastroenterol 2005; 11(21): 3281-3284
- URL: https://www.wjgnet.com/1007-9327/full/v11/i21/3281.htm
- DOI: https://dx.doi.org/10.3748/wjg.v11.i21.3281


