Copyright
©2005 Baishideng Publishing Group Inc.
World J Gastroenterol. Jun 7, 2005; 11(21): 3227-3233
Published online Jun 7, 2005. doi: 10.3748/wjg.v11.i21.3227
Published online Jun 7, 2005. doi: 10.3748/wjg.v11.i21.3227
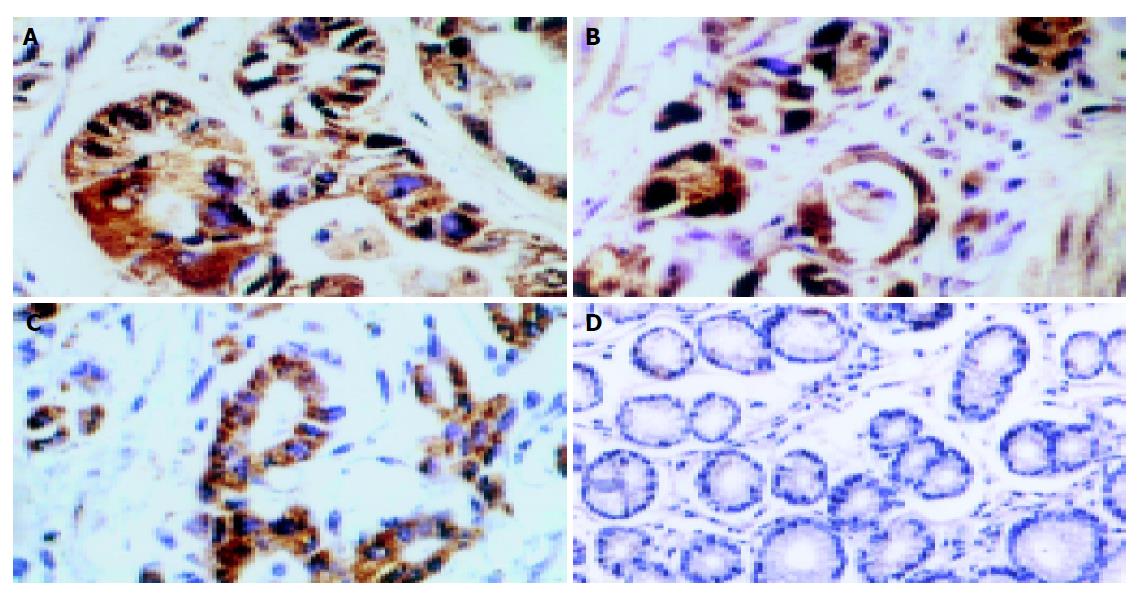
Figure 1 Expression of bFGFmRNA in gastric carcinoma tissues.
A: Positive expression (+++) of bFGFmRNA in the plasma of gastric adenocarcinoma, ISH ×250; B: Positive expression (++) of bFGFmRNA in the plasma of gastric adenocarcinoma, infiltrating stomach muscularis, ISH ×180; C: Positive expression (++) of bFGFmRNA in the plasma of gastric adenocarcinoma, infiltrating greater omentum, ISH ×250; D: Negative expression of bFGF mRNA in normal gastric mucosa, ISH ×120.
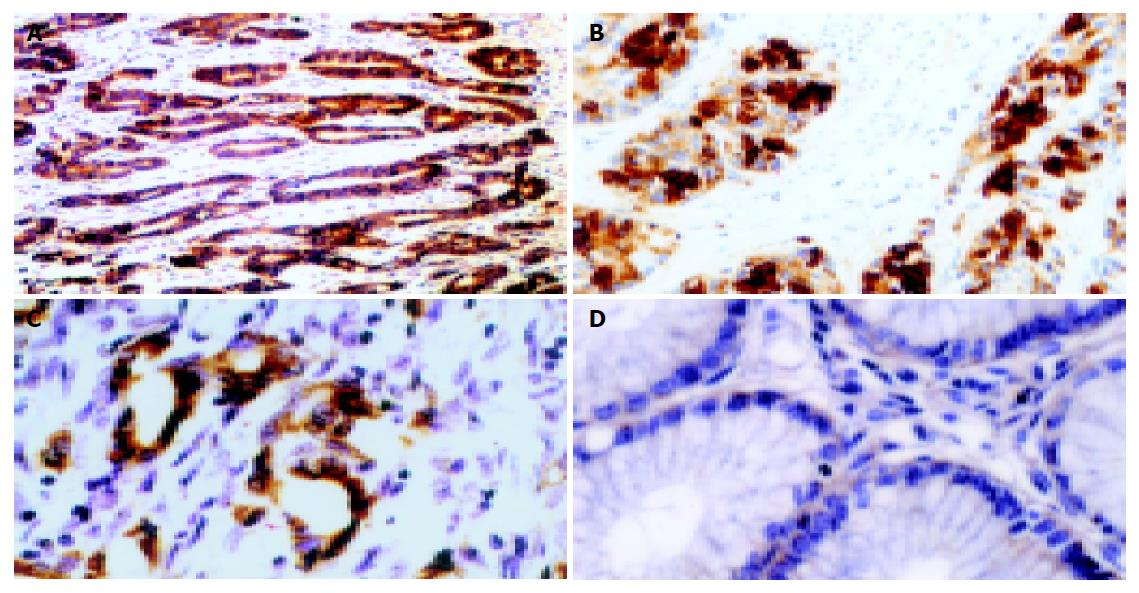
Figure 2 Expression of MMP-9mRNA in gastric carcinoma tissues.
A: Positive expression (+++) of MMP-9mRNA in the plasma of early gastric adenocarcinoma, ISH ×100; B: Positive expression (++) of MMP-9mRNA in the plasma of gastric adenocarcinoma, infiltrating stomach muscularis, ISH ×120; C: Positive expression (++) of MMP-9mRNA in the plasma of gastric adenocarcinoma in peritoneum cancer nodule, ISH ×180; D: Negative expression of MMp-9mRNA in normal gastric mucosa, ISH ×180.
Figure 3 Expression of CD34 protein in gastric carcinoma tissues.
A: Positive expression of CD34 in vascular endothelial cells of gastric adenocarcinoma. SP ×400; B: NO neovascularization and negative expression of CD34 protein in normal gastric mucosa. SP ×280.
Figure 4 Correlative studies on bFGF mRNA and MMP-9 mRNA expressions with microvascular density, progression and prognosis of gastric carcinoma.
A: Kaplan-Meier survival curves of groups with positive and negative bFGFmRNA expression in gastric adenocarcinoma (P<0.05); B: Kaplan-Meier survival curves of groups with positive and negative MMP-9mRNA expression in gastric adenocarcinoma (P<0.05); C: Kaplan-Meier survival curves of groups with MVD ≥ 39.5 and MVD<39.5 in gastric adenocarcinoma (P<0.05).
- Citation: Zhao ZS, Zhou JL, Yao GY, Ru GQ, Ma J, Ruan J. Correlative studies on bFGF mRNA and MMP-9 mRNA expressions with microvascular density, progression, and prognosis of gastric carcinomas. World J Gastroenterol 2005; 11(21): 3227-3233
- URL: https://www.wjgnet.com/1007-9327/full/v11/i21/3227.htm
- DOI: https://dx.doi.org/10.3748/wjg.v11.i21.3227


