Copyright
©2005 Baishideng Publishing Group Inc.
World J Gastroenterol. May 28, 2005; 11(20): 3085-3090
Published online May 28, 2005. doi: 10.3748/wjg.v11.i20.3085
Published online May 28, 2005. doi: 10.3748/wjg.v11.i20.3085
Figure 1 A: Average CAI in the 19 patients at wk 5 and 10 following the start of LCAP treatment; B: Average CRP level in the 19 patients at wk 5 and 10 following the start of LCAP treatment; C: Average EI in 19 patients at wk 5 and 10 following the start of LCAP treatment.
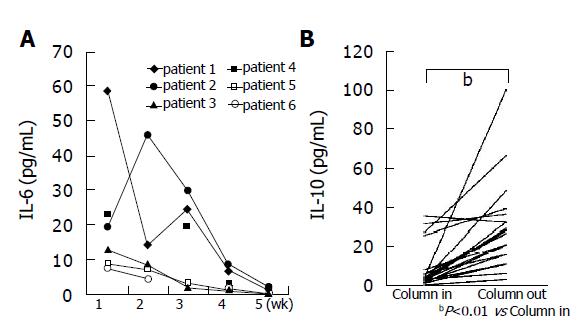
Figure 2 A: The serum IL-6 concentrations in six patients at wk 1, 2, 3, 5, and 10 following the start of LCAP treatment; B: The serum IL-10 concentrations measured at the Cellsorba inflow (at the start of LCAP) and outflow (at the end of LCAP).
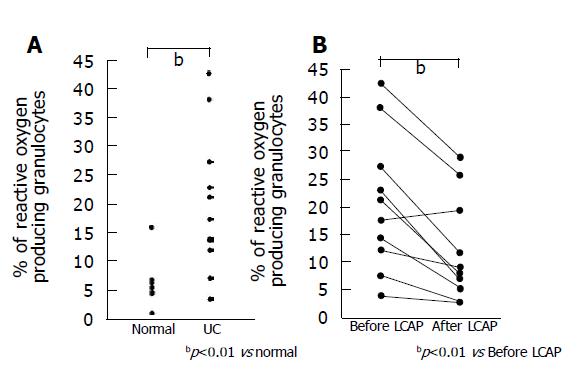
Figure 3 A: Percentage of reactive-oxygen-producing granulocytes in normal subjects (n = 6) and UC patients (n = 11); B: Percentage of reactive-oxygen-producing granulocytes in the peripheral blood of 10 patients before and after LCAP treatment.
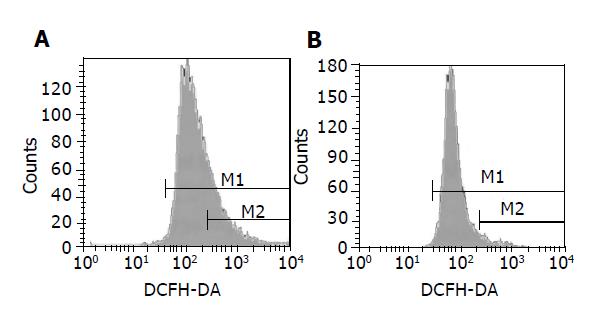
Figure 4 Representative results of FACS analysis in the peripheral blood of one patient before (A) and after (B) LCAP treatment.
The percentages of reactive-oxygen-producing cells in A and B were 22.9% and 7.1%, respectively.
- Citation: Hanai H, Iida T, Takeuchi K, Watanabe F, Maruyama Y, Kikuyama M, Tanaka T, Kondo K, Tanaka K, Takai K. Decrease of reactive-oxygen-producing granulocytes and release of IL-10 into the peripheral blood following leukocytapheresis in patients with active ulcerative colitis. World J Gastroenterol 2005; 11(20): 3085-3090
- URL: https://www.wjgnet.com/1007-9327/full/v11/i20/3085.htm
- DOI: https://dx.doi.org/10.3748/wjg.v11.i20.3085


