Copyright
©2005 Baishideng Publishing Group Inc.
World J Gastroenterol. May 14, 2005; 11(18): 2733-2738
Published online May 14, 2005. doi: 10.3748/wjg.v11.i18.2733
Published online May 14, 2005. doi: 10.3748/wjg.v11.i18.2733
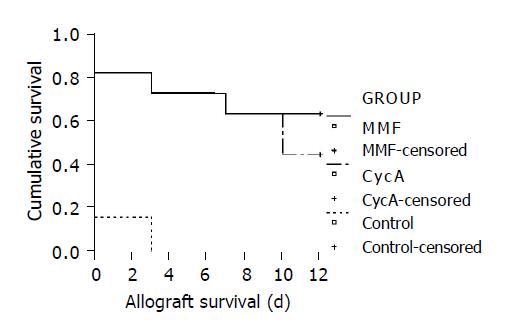
Figure 1 Actuarial allograft survival curves in the three study groups based on serum glucose levels, showing significantly prolonged survival in the two therapy arms in comparison to the controls.
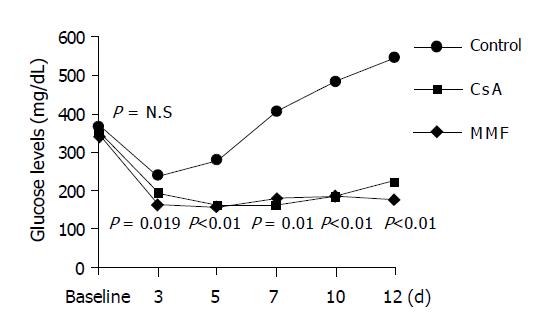
Figure 2 Effect of MMF and CsA on the blood glucose levels of the recipients over time after transplantation.
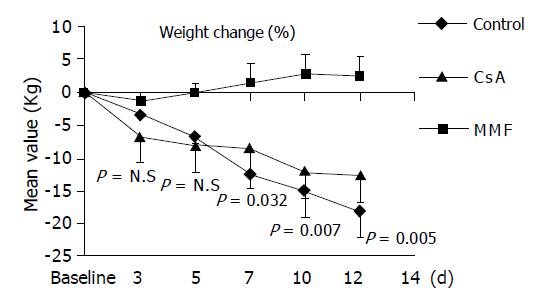
Figure 3 Effect of MMF and CsA on the percentage of weight change of the recipients.
Figure 4 A: Three weak stained islets (long arrows) located into the exocrine tissue 12 d after transplantation without immunosuppression.
A dilated pancreatic duct (short arrow) is also present (anti-insulin, ×200); B: Intact islets into the exocrine tissue (long arrows) 12 d after engraftment and immunosuppression with CsA. The insulin staining is positive and intense (anti-insulin, ×200); C: A well-developed and large islet (long arrow) into the exocrine tissue 12 d after transplantation and immunosuppression with MMF. Anti-insulin stain shows beta cell granulation within islets. At the lower right corner of the figure splenic parenchyma is present (short arrow) (anti-insulin, ×200).
-
Citation: Fotiadis C, Xekouki P, Papalois AE, Antonakis PT, Sfiniadakis I, Flogeras D, Karampela E, Zografos G. Effects of mycophenolate mofetil
vs cyclosporine administration on graft survival and function after islet allotransplantation in diabetic rats. World J Gastroenterol 2005; 11(18): 2733-2738 - URL: https://www.wjgnet.com/1007-9327/full/v11/i18/2733.htm
- DOI: https://dx.doi.org/10.3748/wjg.v11.i18.2733


