Copyright
©2005 Baishideng Publishing Group Inc.
World J Gastroenterol. May 14, 2005; 11(18): 2691-2696
Published online May 14, 2005. doi: 10.3748/wjg.v11.i18.2691
Published online May 14, 2005. doi: 10.3748/wjg.v11.i18.2691
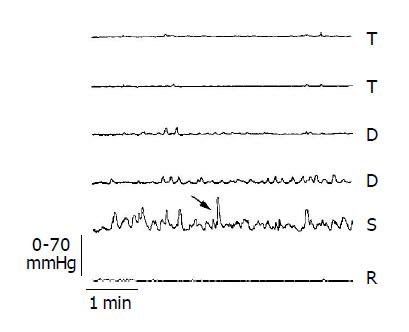
Figure 1 Representative manometric tracing of normal colonic segmental activity.
Note that most contractions feature low amplitude, with sporadic ones (arrow) exceeding 50 mmHg. Recording points are 12 cm apart, and span from the transverse colon (T) to the rectum (R).
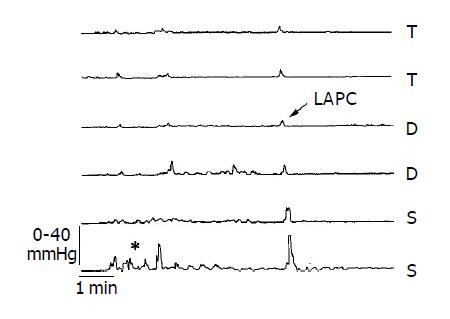
Figure 2 Representative manometric tracing showing a LAPC (arrow).
Note also, in the last tracing, the presence of a burst of segmental sigmoid activity (asterisk). Recording points are 12 cm apart, and span from the transverse (T) to the sigmoid colon (S).
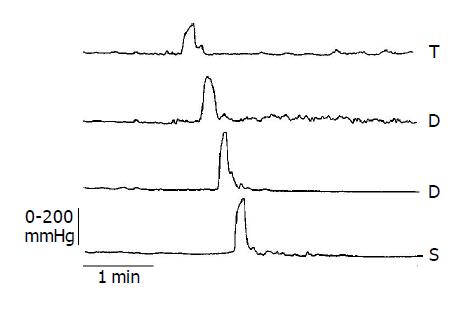
Figure 3 Representative manometric tracing of a HAPC.
Note that the amplitude of the propagated sequence is well distinct with respect to the background segmental activity. Recording points are 12 cm apart, and span from the distal transverse (T) to the proximal sigmoid colon (S).
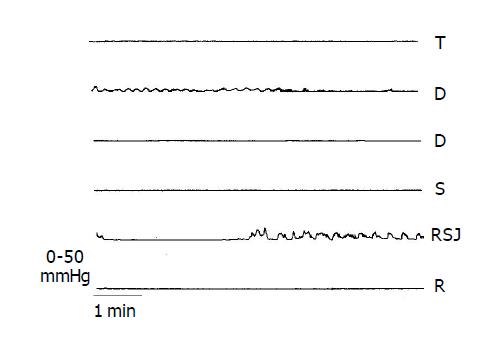
Figure 4 Representative manometric tracing showing two episodes of periodic colonic motor activity (asterisks) occurring independently at different colonic levels (proximal descending colon and rectosigmoid junction, respectively).
Recording points are 12 cm apart, and span from the transverse colon (T) to the rectum (R).
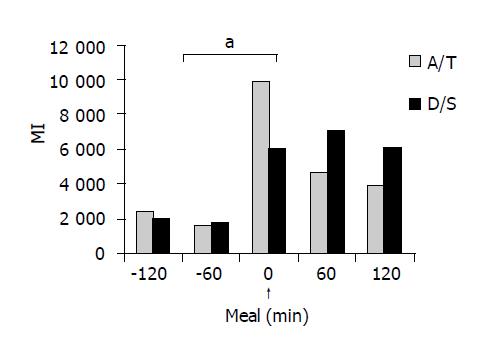
Figure 5 Colonic motor response to eating in normal subjects.
All post-meal values (asterisk) are significantly (aP<0.05) different with respect to basal values in both proximal (A/T) and distal (D/S) segments. MI, motility index.
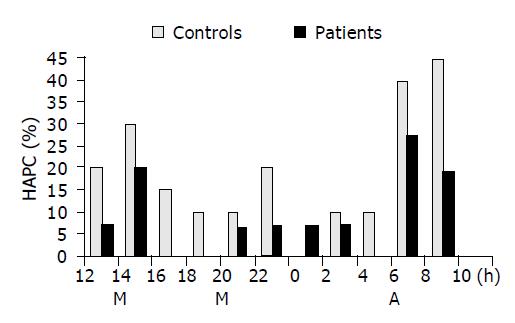
Figure 6 Percentage and distribution of HAPC/24 h in control subjects and severely constipated patients.
M, meal, A, awakening. Adapted from Ref.[65].
- Citation: Bassotti G, Roberto G, Castellani D, Sediari L, Morelli A. Normal aspects of colorectal motility and abnormalities in slow transit constipation. World J Gastroenterol 2005; 11(18): 2691-2696
- URL: https://www.wjgnet.com/1007-9327/full/v11/i18/2691.htm
- DOI: https://dx.doi.org/10.3748/wjg.v11.i18.2691


