Copyright
©2005 Baishideng Publishing Group Inc.
World J Gastroenterol. May 7, 2005; 11(17): 2609-2615
Published online May 7, 2005. doi: 10.3748/wjg.v11.i17.2609
Published online May 7, 2005. doi: 10.3748/wjg.v11.i17.2609
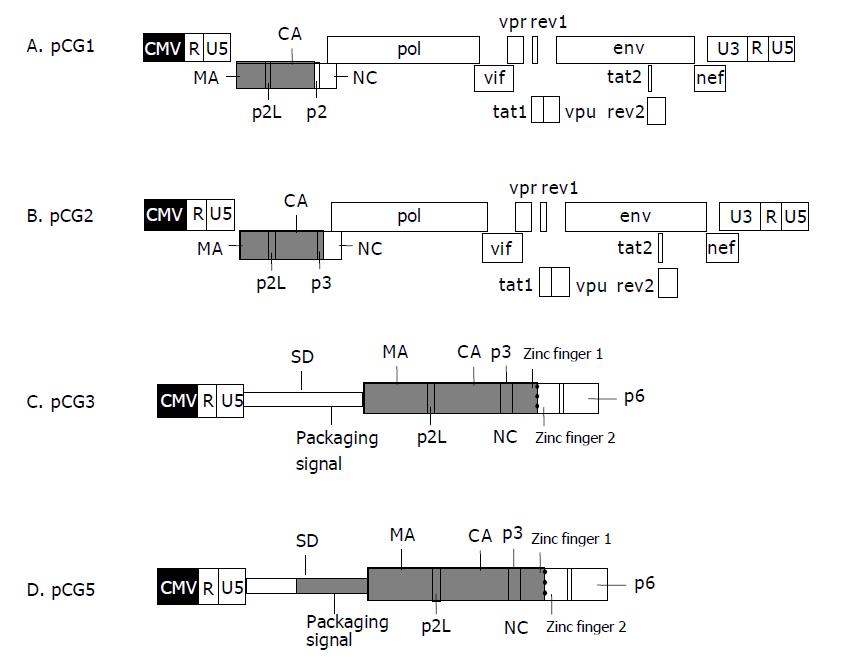
Figure 1 The genomic structure of four chimeric BHIV DNAs.
Yellow: CMV promoter; white: HIV-1 gene; blue: BIV gene.
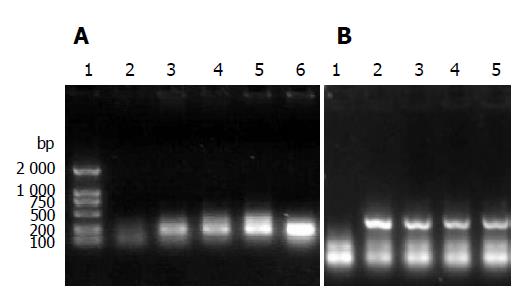
Figure 2 RT-PCR results in 293T cells.
A: HIV-1 tat: 1.DL2000, 2. Negative control 3. pCG1, 4. pcG2, 5. pcG3, 6. pcG5; B: BIV gag: 1. Negative control, 2. pCG1, 3. pCG2, 4. pCG3, 5. pCG5.
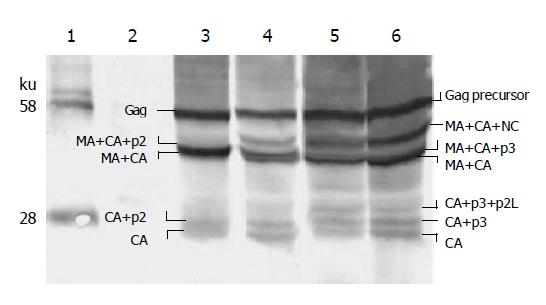
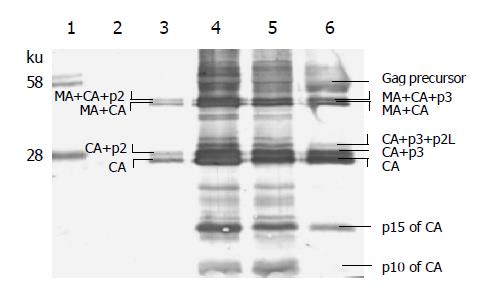
Figure 3 Western blot of 293T cells transfected by chimeric proviral DNAs.
Western blot with rabbit anti-BIV CA serum. Lane 1: Marker; lane 2: 293T cell protein as negative control; lane 3: pCG1; lane 4: pCG2; lane 5: pCG3; lane 6: pCG5.
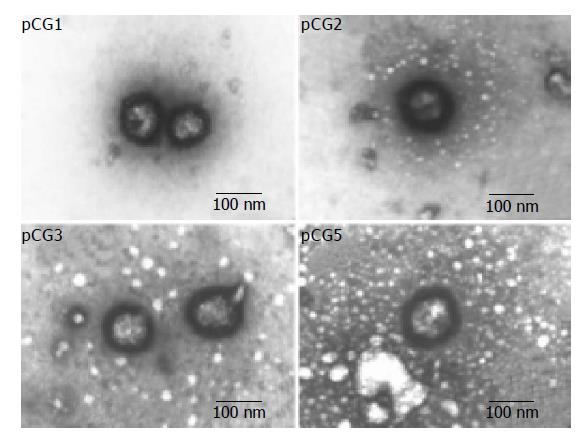
Figure 4 Chimeric virus particles observed by EM.
Figure 5 Western blot of chimeric virions assembled from 293T cells after transfection.
First antibody was anti-BIV CA. Lane 1: Marker; lane 2: 293T cell protein as negative control; lane 3: pCG1; lane 4: pCG2; lane 5: pCG3; lane 6: pCG5.
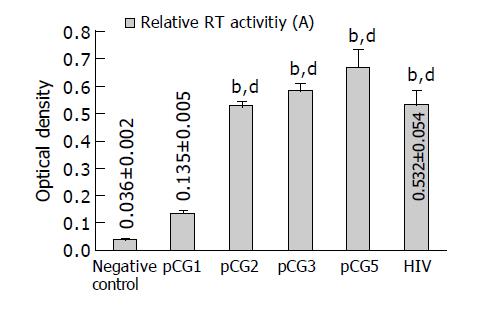
Figure 6 Relative reverse transcriptase activities of chimeric virions in 1 mL supernatant of 293T cells (mean±SD, n = 4).
All samples are positive to negative control (bP<0.01 vs negative control). The RT activity of pCG1 virion was lower than the other three chimeric virions and HIV positive control (dP<0.01 vs pCG1).
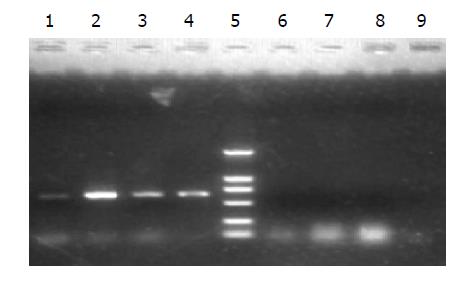
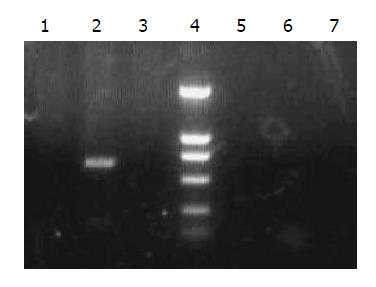
Figure 7 HIV-1 env gene RT-PCR results of chimeric virions.
1. pCG1; 2. pCG2; 3. pCG3, 4. pCG5; 5. DL2000 marker; 6-9: Sample of pCG1, pCG2, pCG3, pCG5 RNAs without adding reverse transcriptase as negative control.
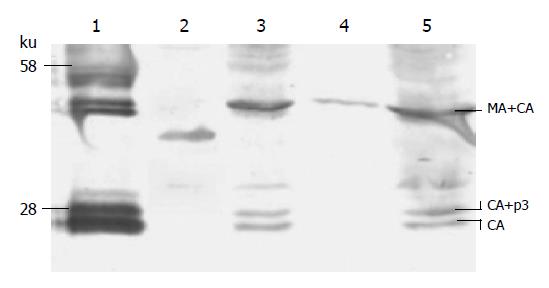
Figure 8 Western blot of chimeric virions infecting MT4 cells.
First antibody was anti-BIV CA. Lane 1: pCG5 virion as positive control; lane 2: MT4 cell protein as negative control; lane 3: pCG2; lane 4: pCG3; lane 5: pCG5.
Figure 9 HIV-1 env gene PCR results of MT4 genomic DNA after infecting chimeric virions.
1. pCG2; 2. pCG3; 3. pCG5; 4. DL2000 marker; 5-7: Culture medium of pCG2, pCG3, pCG5 infecting MT4 (in last 8 h) as negative control.
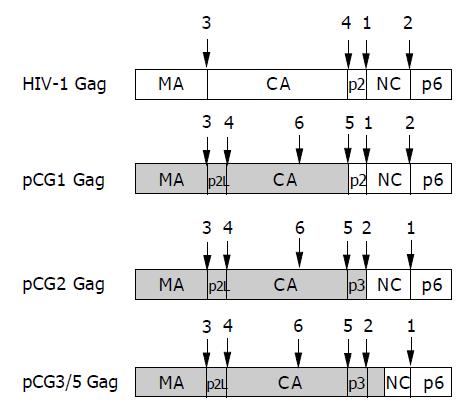
Figure 10 Sketch map of deduced sequential cleavage of chimeric Gag precursor by HIV-1 protease (p1 between NC and p6 is not concerned); numbers show the sequence of the cleavage.
Blue: from BIV; white: from HIV.
- Citation: Zhu YX, Liu C, Liu XL, Qiao WT, Chen QM, Zeng Y, Geng YQ. Construction and characterization of chimeric BHIV (BIV/HIV-1) viruses carrying the bovine immunodeficiency virus gag gene. World J Gastroenterol 2005; 11(17): 2609-2615
- URL: https://www.wjgnet.com/1007-9327/full/v11/i17/2609.htm
- DOI: https://dx.doi.org/10.3748/wjg.v11.i17.2609


