Copyright
©2005 Baishideng Publishing Group Inc.
World J Gastroenterol. Apr 21, 2005; 11(15): 2360-2363
Published online Apr 21, 2005. doi: 10.3748/wjg.v11.i15.2360
Published online Apr 21, 2005. doi: 10.3748/wjg.v11.i15.2360
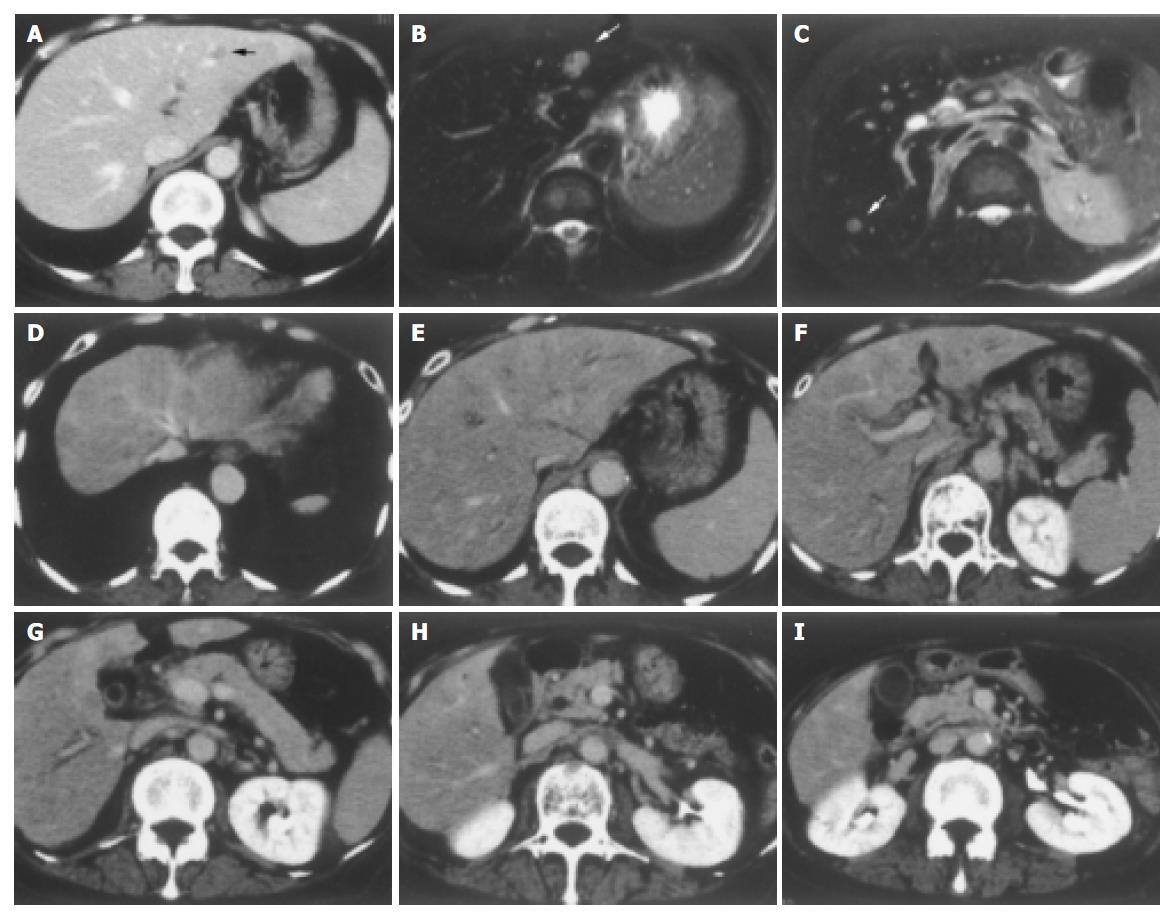
Figure 1 A: Enhanced CT scan on April 2, 2003.
A metastatic lesion in liver S2 (arrowhead). B and C: Enhanced magnetic resonance image with Ferridex on May 19, 2003. Metastatic lesions in S2 (B, arrowhead) and S6 (C, arrowhead). D-I: Dynamic study by CT scan on admission. Uneven enhancement effect of the liver in late phase.
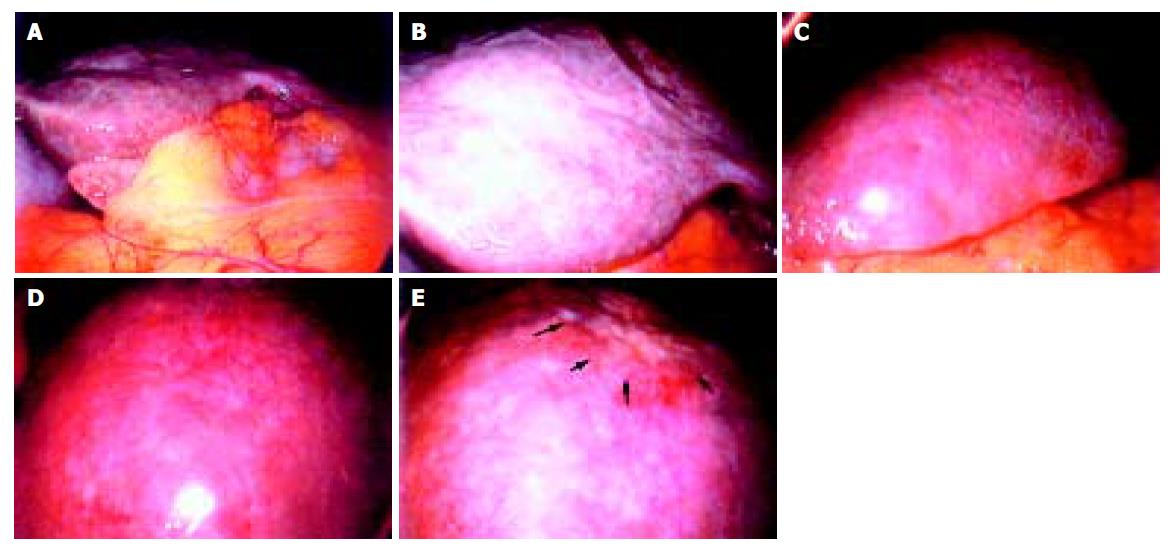
Figure 2 Irregular and deformed liver surface with multiple indentations and shallow linear depressions (A and B: right lobe, C and D: left lobe).
A wide scar on the surface of S2 at the site where metastatic tumor existed before chemotherapy (E, arrowheads).
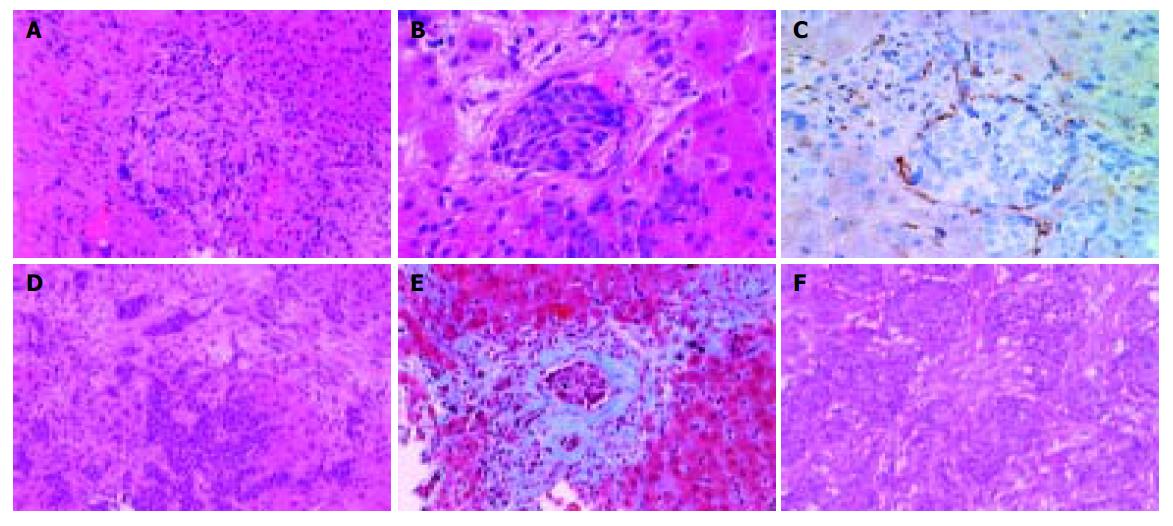
Figure 3 A: Laparoscopic liver biopsy from a wide scar lesion showed residual cancer cells scattered in a wide fibrous band in one area (hematoxylin and eosin (HE) stain).
B and C: In another area intraportal tumor thrombi were clearly demonstrated. Endothelial cells were stained brown by CD31 immunohistochemistry (B, HE stain, C, CD31 immunohistochemical stain). D and E: Cancer cells showed desmoplastic change around them, which extended toward the sinusoids (D, HE stain, E, Masson’s trichrome stain). F: Original breast cancer. Note desmoplastic change around the tumor cells (HE stain).
- Citation: Nakajima T, Sekoguchi S, Nishikawa T, Takashima H, Watanabe T, Minami M, Itoh Y, Mizuta N, Nakajima H, Mazaki T, Yanagisawa A, Okanoue T. Multifocal intraportal invasion of breast carcinoma diagnosed by laparoscopy-assisted liver biopsy. World J Gastroenterol 2005; 11(15): 2360-2363
- URL: https://www.wjgnet.com/1007-9327/full/v11/i15/2360.htm
- DOI: https://dx.doi.org/10.3748/wjg.v11.i15.2360


