Copyright
©2005 Baishideng Publishing Group Inc.
World J Gastroenterol. Apr 14, 2005; 11(14): 2109-2116
Published online Apr 14, 2005. doi: 10.3748/wjg.v11.i14.2109
Published online Apr 14, 2005. doi: 10.3748/wjg.v11.i14.2109
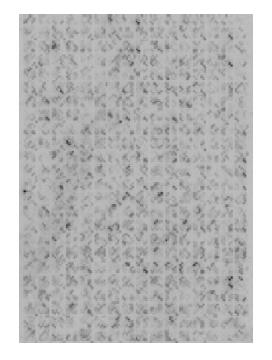
Figure 1 Half of an array hybridization image from a normal gallbladder sample.
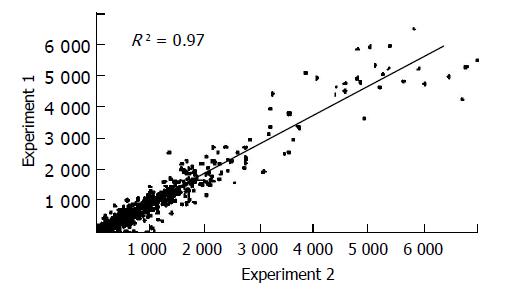
Figure 2 Scatterplot of two independent cDNA array analyses of the same sample.
Each point stands for a gene or cDNA cluster, with the X coordinate representing the gene expression level in one test and the Y representing the value of the other test. An R2 of 0.97 indicates high reproducibility of the cDNA array assay.
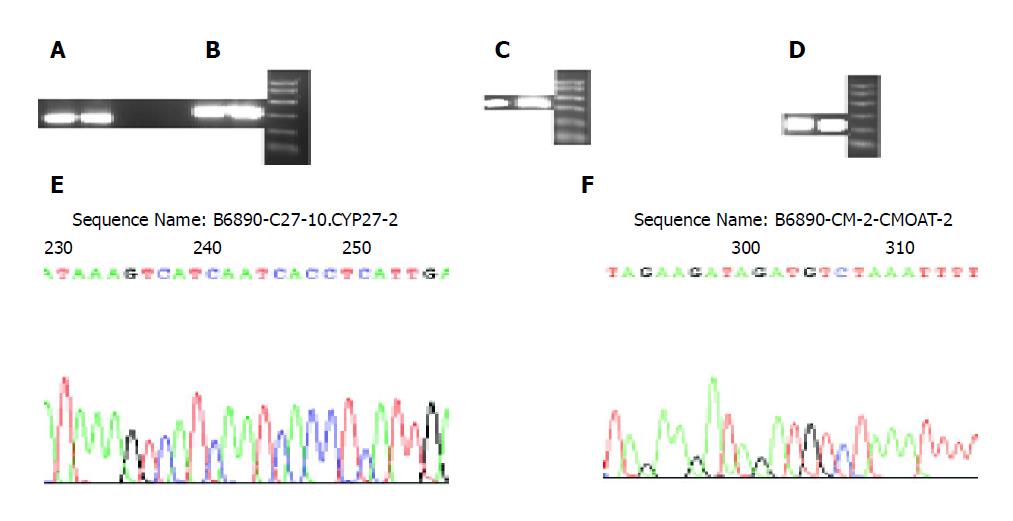
Figure 3 RT-PCR and sequencing confirmation of genes that were expressed in the gallbladder.
RT-PCR electrophoresis result: A: CYP27A1(320 bp); B: NR1H4(352 bp); C: CMOAT(353 bp); D: AKR1C3(240 bp). Sequencing result of PCR product: E: CYP27A1; F: CMOAT.
- Citation: Yuan ZB, Han TQ, Jiang ZY, Fei J, Zhang Y, Qin J, Tian ZJ, Shang J, Jiang ZH, Cai XX, Jiang Y, Zhang SD, Jin G. Expression profiling suggests a regulatory role of gallbladder in lipid homeostasis. World J Gastroenterol 2005; 11(14): 2109-2116
- URL: https://www.wjgnet.com/1007-9327/full/v11/i14/2109.htm
- DOI: https://dx.doi.org/10.3748/wjg.v11.i14.2109


