Copyright
©2005 Baishideng Publishing Group Inc.
World J Gastroenterol. Apr 14, 2005; 11(14): 2095-2100
Published online Apr 14, 2005. doi: 10.3748/wjg.v11.i14.2095
Published online Apr 14, 2005. doi: 10.3748/wjg.v11.i14.2095
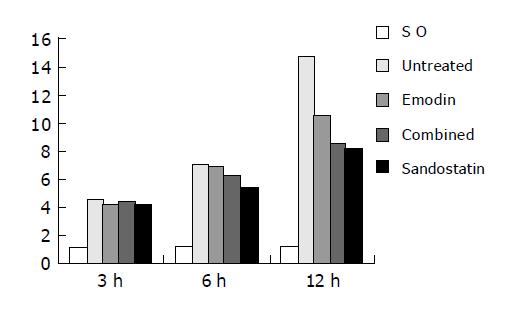
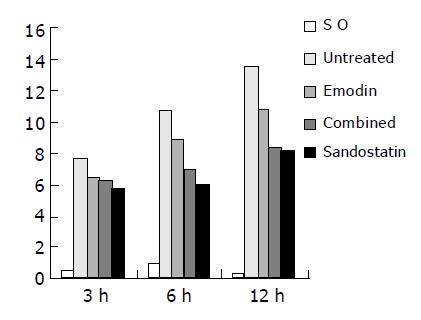
Figure 1 Ascites volume of each group.
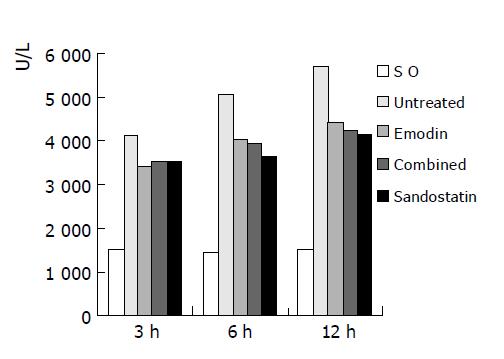
Figure 2 Serum amylase level of each group.
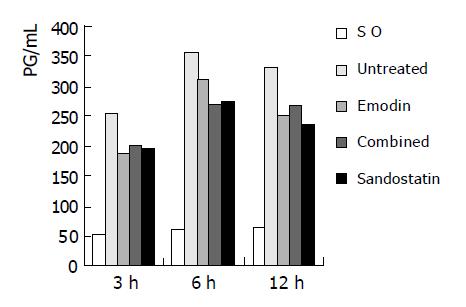
Figure 3 Serum TNF-α levels of each group.
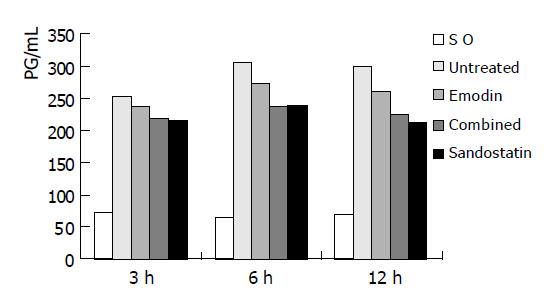
Figure 4 The serum IL-6 levels of each group.
Figure 5 Pathological lesion score for pancreas of each group.
- Citation: Zhang XP, Li ZF, Liu XG, Wu YT, Wang JX, Wang KM, Zhou YF. Effects of emodin and baicalein on rats with severe acute pancreatitis. World J Gastroenterol 2005; 11(14): 2095-2100
- URL: https://www.wjgnet.com/1007-9327/full/v11/i14/2095.htm
- DOI: https://dx.doi.org/10.3748/wjg.v11.i14.2095


