Copyright
©2005 Baishideng Publishing Group Inc.
World J Gastroenterol. Apr 7, 2005; 11(13): 2026-2031
Published online Apr 7, 2005. doi: 10.3748/wjg.v11.i13.2026
Published online Apr 7, 2005. doi: 10.3748/wjg.v11.i13.2026
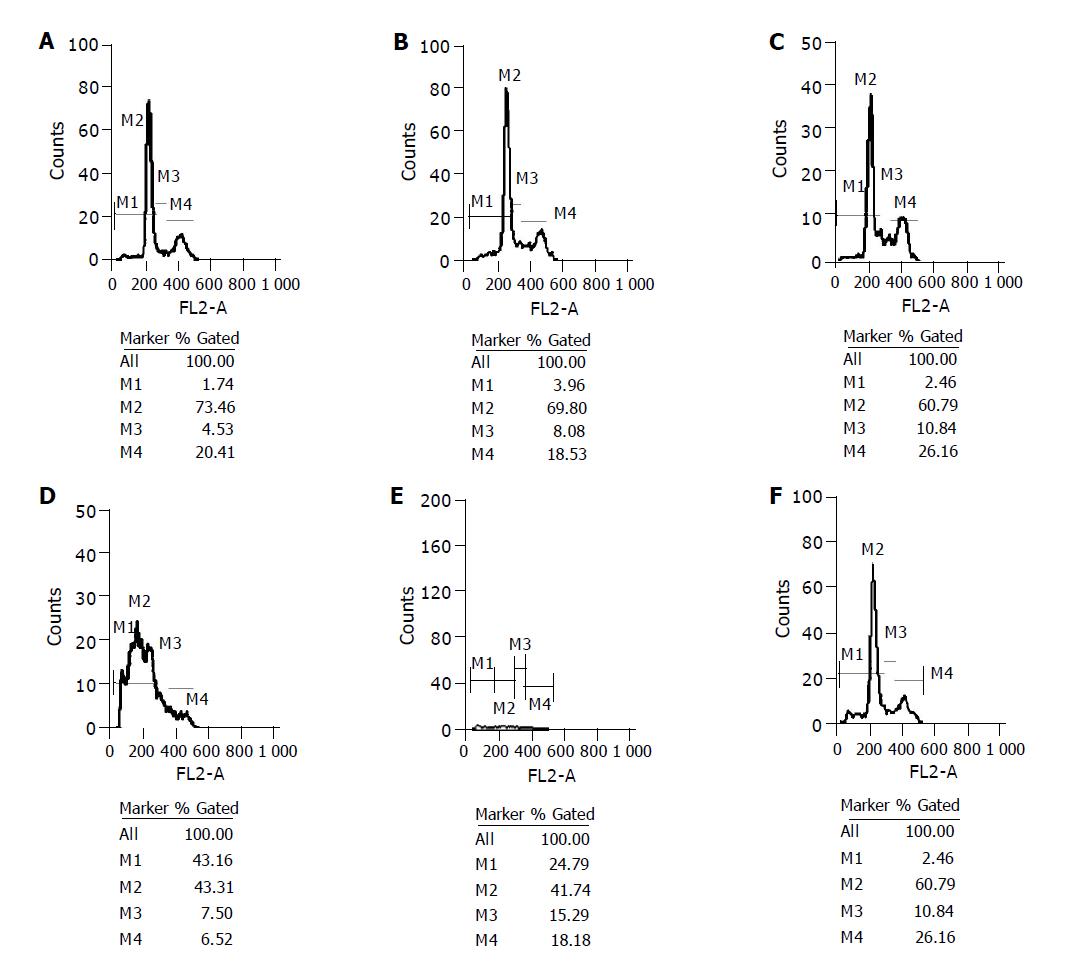
Figure 1 Apoptosis analysis of cells interfered by siRNA by FACS.
A: Normal cells; B: Cells transfected without DNA; C: Cells interfered by nonspecific siRNA; D: Cells interfered by site 194 siRNA; E: Cells interfered by site 491 siRNA; F: Cells interfered by site 327 siRNA.
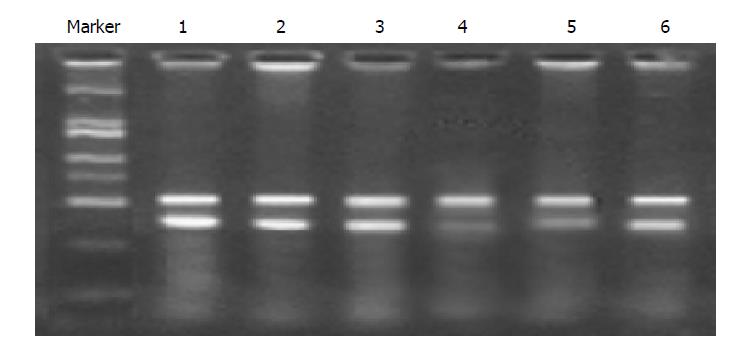
Figure 2 Detection of the inhibition of K-ras mRNA expression in MiaPaCa-2 cells by RT-PCR.
Marker DNA2000 Marker; Lane 1: Normal cells; Lane 2: Cells transfected without DNA; Lane 3: Cells interfered by nonspecific siRNA; Lane 4: Cells interfered by site 194 siRNA; Lane 5: Cells interfered by site 491 siRNA; Lane 6: Cells interfered by site 327 siRNA; β-actin is a control.
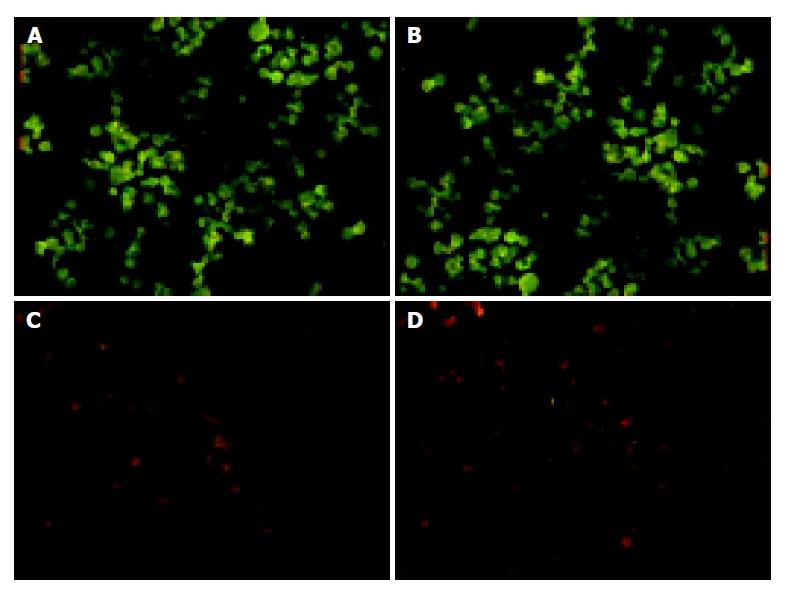
Figure 3 Detection of inhibition of K-ras protein expression in MiaPaCa-2 cells by immunofluorescence.
A: Normal cells; B: Cells interfered by site 327 siRNA; C: Cells interfered by site 194 siRNA; D: Cells interfered by site 491 siRNA.
- Citation: Wang W, Wang CY, Dong JH, Chen X, Zhang M, Zhao G. Identification of effective siRNA against K-ras in human pancreatic cancer cell line MiaPaCa-2 by siRNA expression cassette. World J Gastroenterol 2005; 11(13): 2026-2031
- URL: https://www.wjgnet.com/1007-9327/full/v11/i13/2026.htm
- DOI: https://dx.doi.org/10.3748/wjg.v11.i13.2026


