Copyright
©2005 Baishideng Publishing Group Inc.
World J Gastroenterol. Apr 7, 2005; 11(13): 2000-2003
Published online Apr 7, 2005. doi: 10.3748/wjg.v11.i13.2000
Published online Apr 7, 2005. doi: 10.3748/wjg.v11.i13.2000
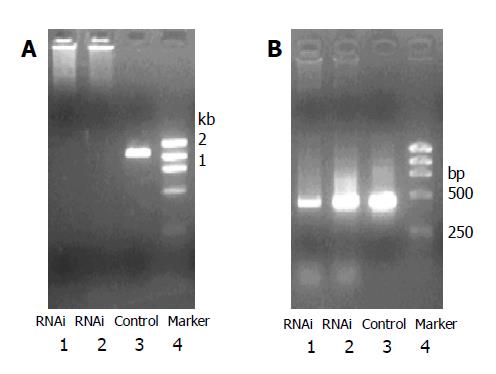
Figure 1 A: The significant suppression of mRNA expression in MKN45 before and after RNAi (lanes 1 and 2) compared with the control cells (lane 3); B: β-actin control; 1: IIsiRNA, 2: IsiRNA 3: control, 4: DL2000.
Figure 2 Downregulated E-cadherin expression (C): On the 12th d of interference; B: On the 10th d of interference) in MKN45 cells undergoing RNAi compared with that in control group (A).
- Citation: Zheng ZH, Sun XJ, Zhou HT, Shang C, Ji H, Sun KL. Analysis of metastasis suppressing function of E-cadherin in gastric cancer cells by RNAi. World J Gastroenterol 2005; 11(13): 2000-2003
- URL: https://www.wjgnet.com/1007-9327/full/v11/i13/2000.htm
- DOI: https://dx.doi.org/10.3748/wjg.v11.i13.2000


