Copyright
©2005 Baishideng Publishing Group Inc.
World J Gastroenterol. Apr 7, 2005; 11(13): 1987-1990
Published online Apr 7, 2005. doi: 10.3748/wjg.v11.i13.1987
Published online Apr 7, 2005. doi: 10.3748/wjg.v11.i13.1987
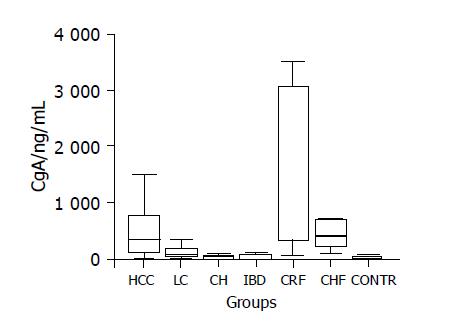
Figure 1 Box-plot diagram showing the distribution of CgA values in the groups studied.
Abbreviations: HCC, hepatocellular carcinoma; LC, liver cirrhosis; CH, chronic hepatitis; IBD, inflammatory bowel disease; CRF, chronic renal failure; CHF, chronic heart failure; CONTR, controls.
- Citation: Spadaro A, Ajello A, Morace C, Zirilli A, D’arrigo G, Luigiano C, Martino F, Bene A, Migliorato D, Turiano S, Ferraù O, Freni MA. Serum chromogranin-A in hepatocellular carcinoma: Diagnostic utility and limits. World J Gastroenterol 2005; 11(13): 1987-1990
- URL: https://www.wjgnet.com/1007-9327/full/v11/i13/1987.htm
- DOI: https://dx.doi.org/10.3748/wjg.v11.i13.1987


