Copyright
©2005 Baishideng Publishing Group Inc.
World J Gastroenterol. Apr 7, 2005; 11(13): 1951-1956
Published online Apr 7, 2005. doi: 10.3748/wjg.v11.i13.1951
Published online Apr 7, 2005. doi: 10.3748/wjg.v11.i13.1951
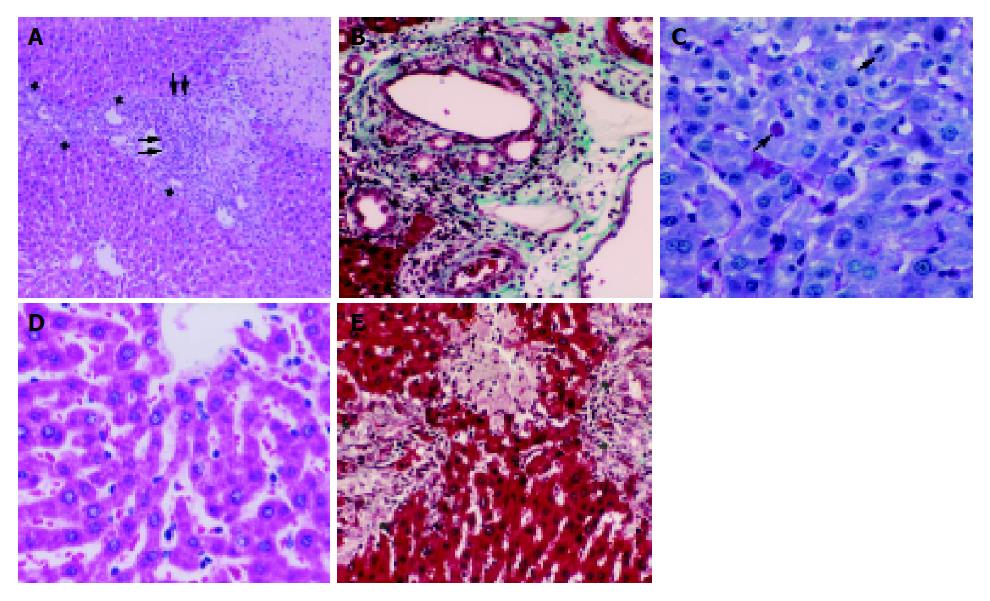
Figure 1 A: BDL group.
Portal fibrosis (f) with bile duct proliferation (thick arrows) and cell infiltration (arrows), and a large area of coagulation necrosis (n) are observed. H-E, ×10; B: BDL group. Portal fibrosis (f) with bile duct proliferation (arrows) and cell infiltration is observed. Portal vein (p) is highly enlarged. Masson’s trichrom, ×20; C:BDL group. A massive loss in the amount of glycogen in hepatocytes is seen. There are a mitotic figure (arrow) and an apoptotic body (double arrow) in the parenchyma. PAS, ×40; D: BDL+melatonin group. Section is normal in histological appearance. Hepatocytes arranged as cords of cells radiating from central vein (c) are observed. H-E, ×40; E: BDL+melatonin group. Portal fibrosis is not evident. Bile duct proliferation is obvious (arrows). A small area of necrosis (n) is present between proliferated ducts. Masson’s trichrom, ×20.
- Citation: Esrefoglu M, Gül M, Emre MH, Polat A, Selimoglu MA. Protective effect of low dose of melatonin against cholestatic oxidative stress after common bile duct ligation in rats. World J Gastroenterol 2005; 11(13): 1951-1956
- URL: https://www.wjgnet.com/1007-9327/full/v11/i13/1951.htm
- DOI: https://dx.doi.org/10.3748/wjg.v11.i13.1951


