Copyright
©2005 Baishideng Publishing Group Inc.
World J Gastroenterol. Apr 7, 2005; 11(13): 1903-1909
Published online Apr 7, 2005. doi: 10.3748/wjg.v11.i13.1903
Published online Apr 7, 2005. doi: 10.3748/wjg.v11.i13.1903
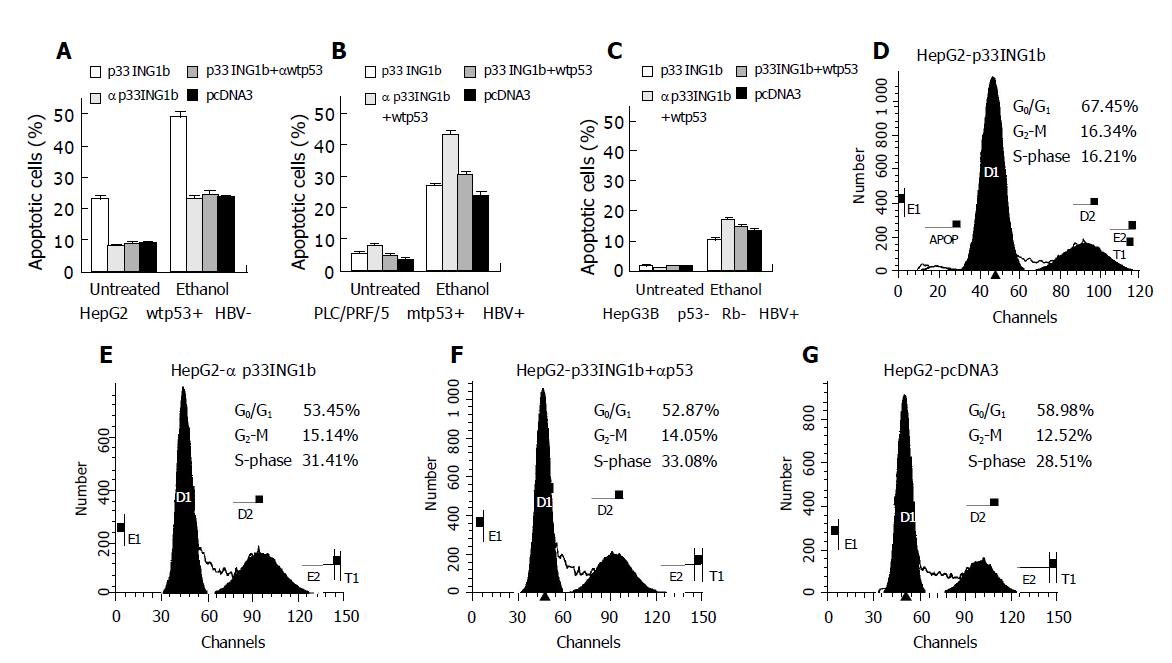
Figure 1 FACS analysis of cell apoptosis in three hepatoma cell lines (A-C) and arrest of HepG2 cells at G0/G1 cell cycle (D-G).
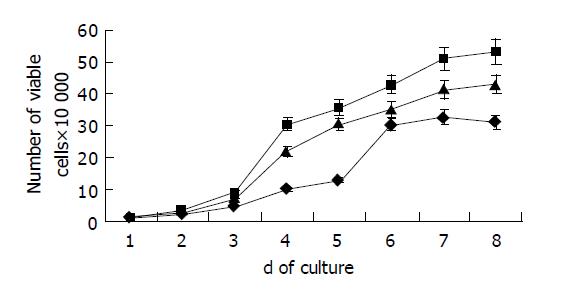
Figure 2 Growth curves for HepG2 cells stably transfected with pcDNA3 (▲), pcDNA3-p33ING1b (●), or pcDNA3-α p33ING1b (■) in complete medium containing 10% serum.
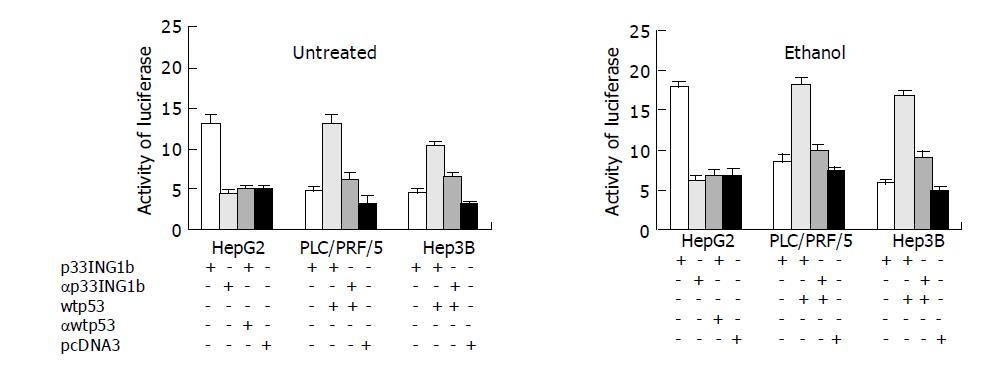
Figure 3 Analysis of p21WAF1/CIP1 promoter activation in three hepatoma cell lines.
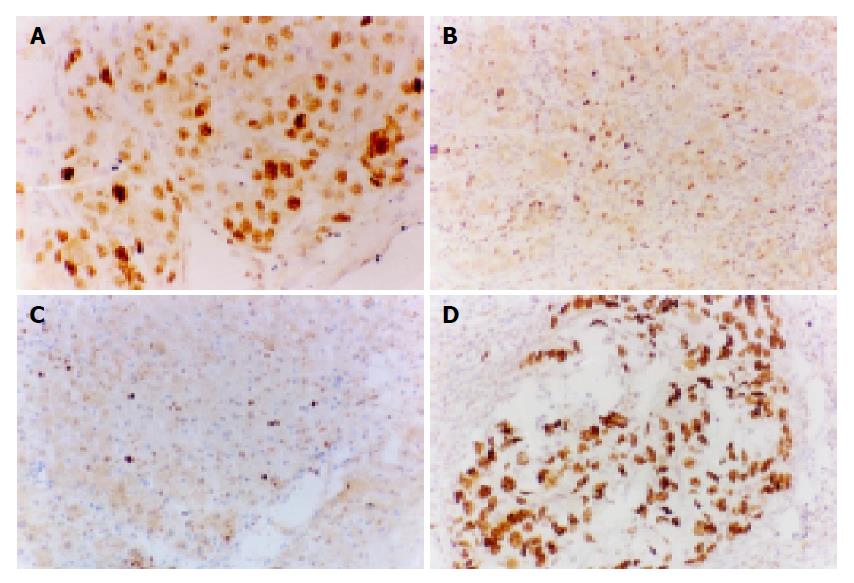
Figure 4 IHC staining for p33ING1b on HCC (A), para-cancerous tissues (B), and normal liver tissues (C), and for p53 on HCC (D).
A and D: p33ING1b and p53 were nuclear-positive and located in the same area of HCC, ×400; B and C: p33ING1b presented weak IHC staining, ×200.
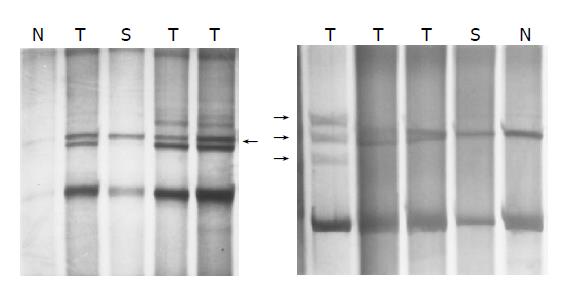
Figure 5 Altered migration pattern of PCR products of p33ING1b gene from HCC genomic DNA by SSCP.
N, normal DNA; T, tumor DNA; S, para-cancerous tissue DNA.
- Citation: Zhu Z, Lin J, Qu JH, Feitelson MA, Ni CR, Li FM, Zhu MH. Inhibitory effect of tumor suppressor p33ING1b and its synergy with p53 gene in hepatocellular carcinoma. World J Gastroenterol 2005; 11(13): 1903-1909
- URL: https://www.wjgnet.com/1007-9327/full/v11/i13/1903.htm
- DOI: https://dx.doi.org/10.3748/wjg.v11.i13.1903


