Copyright
©The Author(s) 2004.
World J Gastroenterol. Apr 15, 2004; 10(8): 1171-1175
Published online Apr 15, 2004. doi: 10.3748/wjg.v10.i8.1171
Published online Apr 15, 2004. doi: 10.3748/wjg.v10.i8.1171
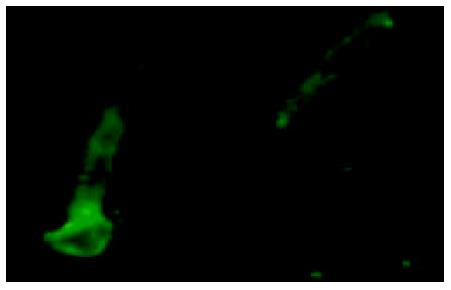
Figure 1 Specific binding of anti-β1-receptor autoantibodies to guinea pig cardiac myocytes.
Rod-shaped cardiac myocytes were stained by immunofluorescence (second IgG labeled with FITC), suggesting the specific binding of anti-β1-receptor autoantibodies to cardiac myocytes.
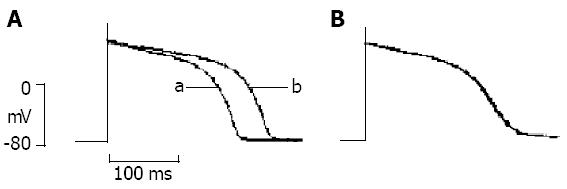
Figure 2 AP recordings before and after superfusion with anti-β1-receptor diluted at 1:80 in the absence and presence of 1 μmol/L metoprolol.
A: effect of anti-β1-receptor diluted an 1:80 on AP. arepresents AP before superfusion with 1:80 anti-β1-receptor autoantibodies, brepresents AP after superfusion with 1:80 anti-β1-receptor autoantibodies. B: no marked changes of AP after superfusion with 1:80 anti-β1-receptor autoantibod-ies in the presence of 1 μmol/L metoprolol.
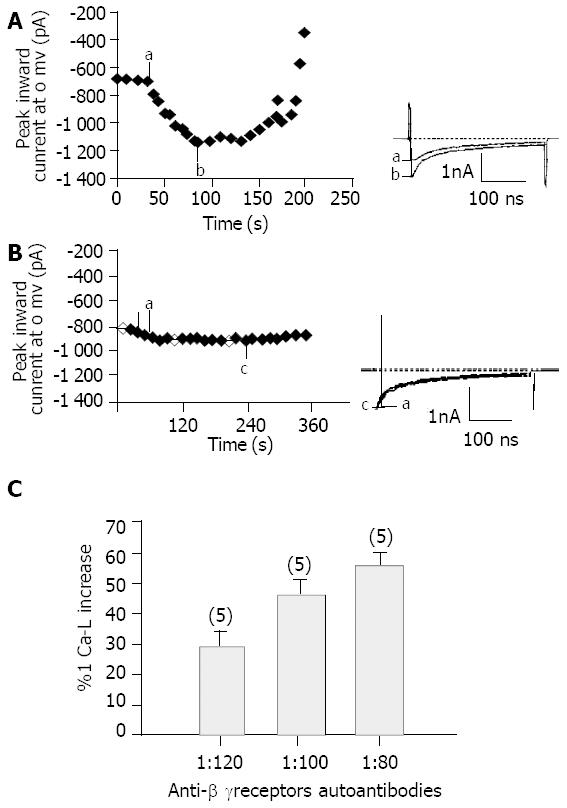
Figure 3 Effects of anti-β1-receptor autoantibodies on peak current amplitude of ICa-L in the absence and presence of 1 μmol/L metoprolol.
A and B (left): time-course changes of peak cur-rent amplitude of ICa-L before and after superfusion with anti-β1-receptor autoantibodies diluted at 1:80 (A) or in the pres-ence of 1 μmol/L metoprolol (B). A and B (right): traces of ICa-L before and after superfusion with anti-β1-receptor autoanti-bodies diluted at 1:80 (A) or before and after superfusion with anti-β1-receptor autoantibodies diluted an 1:80 in the pres-ence of 1 μmol/L metoprolol (B). arepresents the maximal peak current amplitude of I Ca-L before superfusion with anti-β1-receptor autoantibodies diluted at 1:80, brepresents the maximal peak current amplitude of ICa-L after superfusion with anti-β1-receptor autoantibodies diluted an 1:80. crepresents the maximal peak current amplitude of ICa-L after superfusion with anti-β1-receptor autoantibodies diluted at 1:80 in the pres-ence of 1 μmol/L metoprolol. C: concentration dependence of anti-β1-receptor autoantibodies. The numbers in brackets in-dicate the number of cells studied at each concentration.
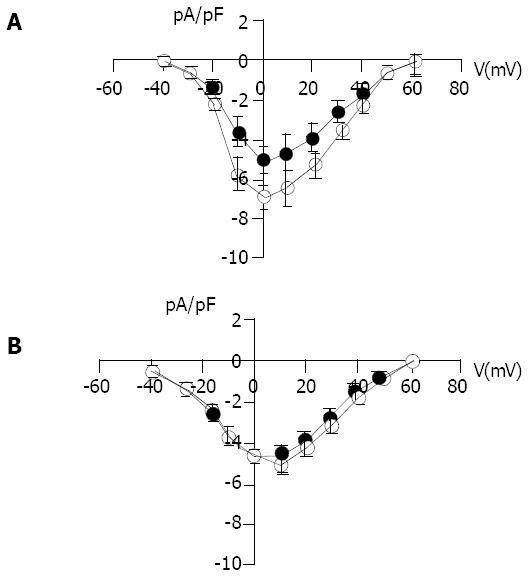
Figure 4 Effects of anti-β1-receptor autoantibodies diluted at 1: 100 on current-voltage (I-V) relationships normalized to cell membrane capacitance measured in 5 cells (mean ± SEM) dur-ing voltage steps from –40 to +60 mV in the absence (A) and presence of 1 μmol/L metoprolol (B).
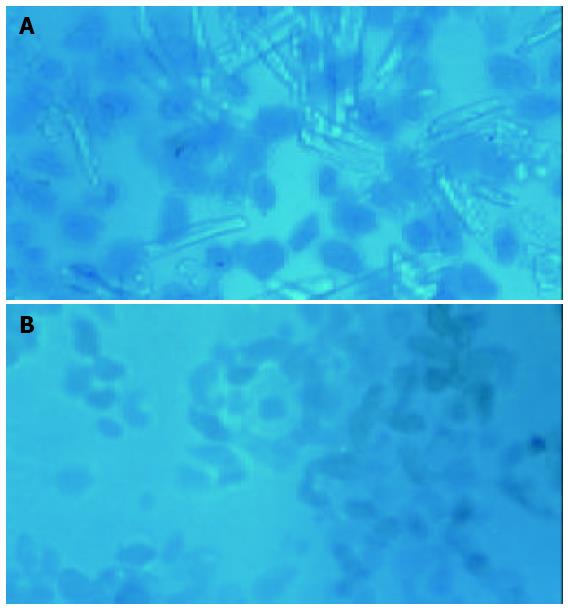
Figure 5 Cell toxicity effect of cardiac myocytes exposed to high concentrations of anti-β1-receptors autoantibodies.
A: rod-shaped cells excluding trypan blue. B: rounded cells perme-able to trypan blue.
- Citation: Liu K, Liao YH, Wang ZH, Li SL, Wang M, Zeng LL, Tang M. Effects of autoantibodies against β1-adrenoceptor in hepatitis virus myocarditis on action potential and L-type Ca2+ currents. World J Gastroenterol 2004; 10(8): 1171-1175
- URL: https://www.wjgnet.com/1007-9327/full/v10/i8/1171.htm
- DOI: https://dx.doi.org/10.3748/wjg.v10.i8.1171


