Copyright
©The Author(s) 2004.
World J Gastroenterol. Apr 15, 2004; 10(8): 1146-1151
Published online Apr 15, 2004. doi: 10.3748/wjg.v10.i8.1146
Published online Apr 15, 2004. doi: 10.3748/wjg.v10.i8.1146
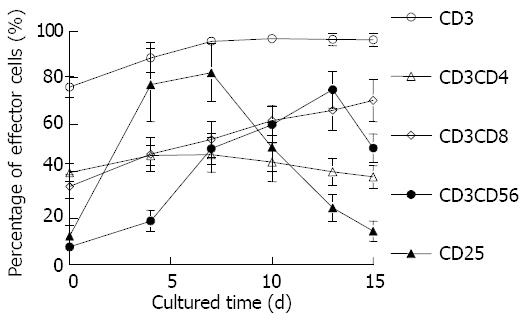
Figure 1 Dynamic analysis of CIK cellular phenotypes by flow cytometry.
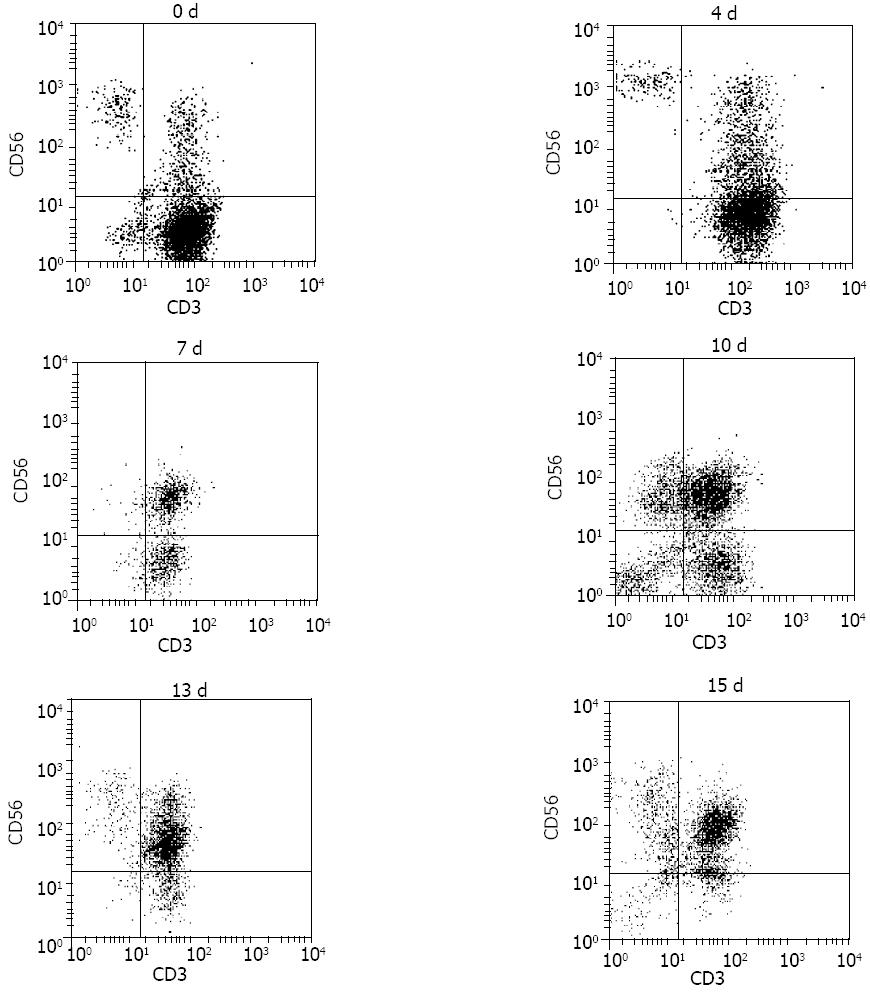
Figure 2 Phenotypic analysis of CD3+CD56+ cells in cultured cells by flow cytometry in various culture time.
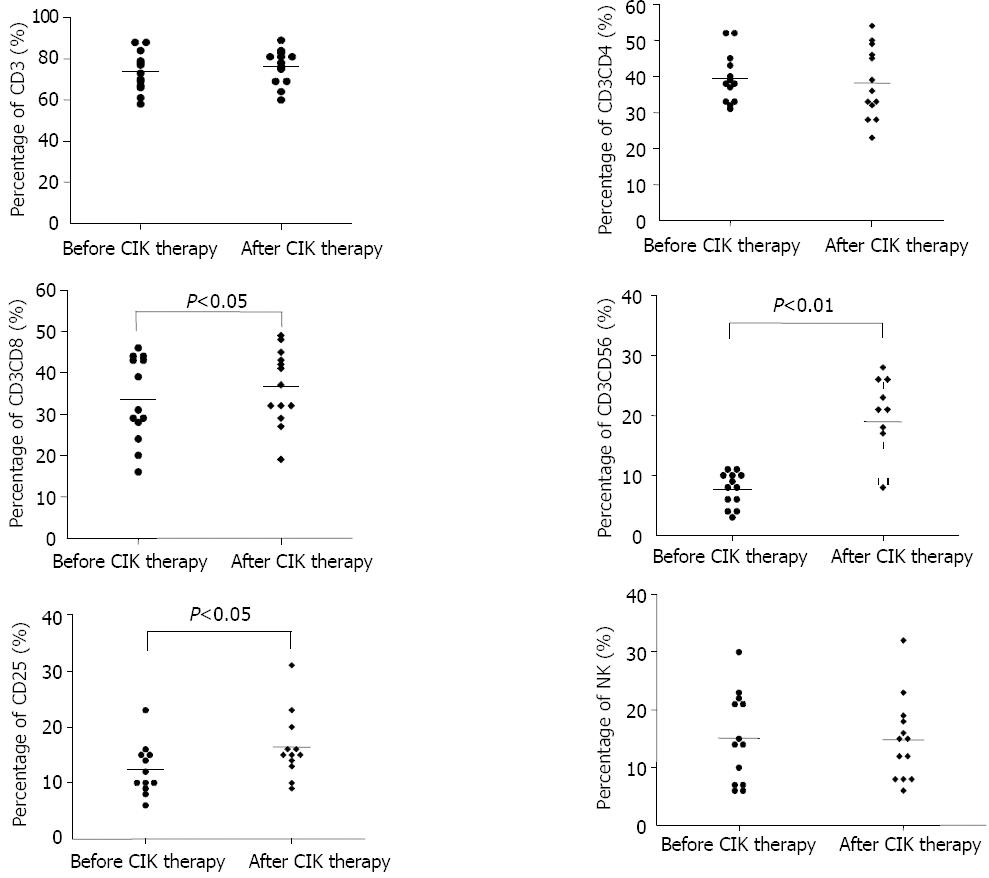
Figure 3 Percentages of lymphocyte subsets in peripheral blood of HCC patients before and after CIK cell therapy.
Figure 4 Proportions of DCs in HCC patient peripheral blood before and after CIK cell transfusion.
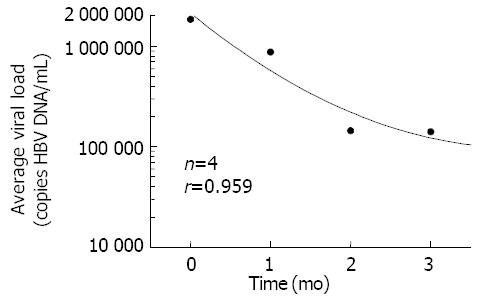
Figure 5 Average HBV viral load in HCC patient serum before and after CIK cell transfusion.
- Citation: Shi M, Zhang B, Tang ZR, Lei ZY, Wang HF, Feng YY, Fan ZP, Xu DP, Wang FS. Autologous cytokine-induced killer cell therapy in clinical trial phase I is safe in patients with primary hepatocellular carcinoma. World J Gastroenterol 2004; 10(8): 1146-1151
- URL: https://www.wjgnet.com/1007-9327/full/v10/i8/1146.htm
- DOI: https://dx.doi.org/10.3748/wjg.v10.i8.1146


