Copyright
©The Author(s) 2004.
World J Gastroenterol. Mar 15, 2004; 10(6): 875-880
Published online Mar 15, 2004. doi: 10.3748/wjg.v10.i6.875
Published online Mar 15, 2004. doi: 10.3748/wjg.v10.i6.875
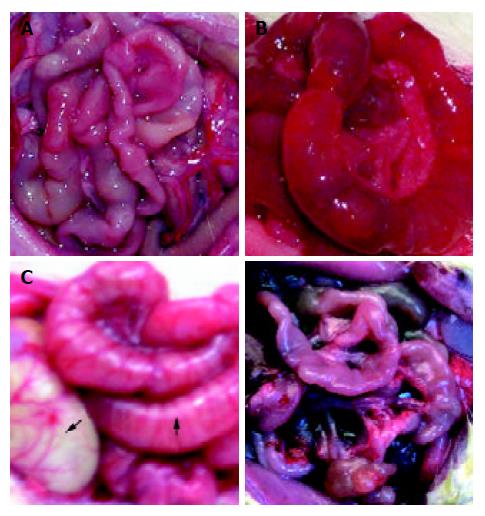
Figure 1 Gross observation of intestinal pathology was shown as A, B, C and D.
A: nearly normal morphology at TBI 3 h; B: intestinal dilation with large amount of yellowish effusion and thin edema-tous wall at 72 h following TBI; C: gastrointestinal distention at 72 h following TBI, stomach indicated by solid arrow and intestine by blank arrow; D: gastrointestinal atrophy on day 7 following TBI.
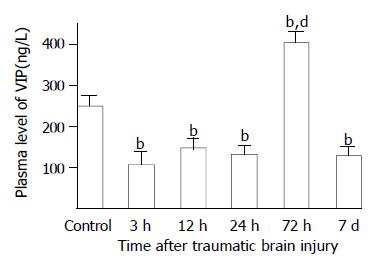
Figure 2 Alteration of VIP in plasma after TBI.
Compared with control, plasma level of VIP was significantly decreased at 3, 12 and 24 h postinjury, but was significantly increased at 72 h, then declined to a low level on d 7 with the value similar to that of groups of 3 h, 12 h and 24 h. bP < 0.01 vs control; dP < 0.01 vs 3 h, 12 h, 24 h and 7 d.
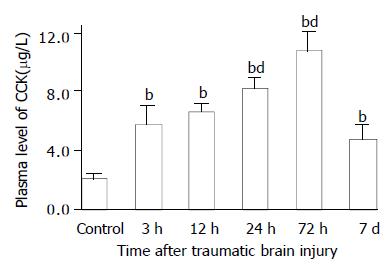
Figure 3 Alteration of CCK in plasma after TBI.
Compared with control, plasma level of CCK was significantly increased postinjury, and peaked at 72 h, then declined to some degree on d 7, but was still significantly higher than that of control. bP < 0.01 vs control; dP < 0.01 vs 3 h. Mean ± SD of 6 animals, control: 2.1 ± 0.3 µg/L, 3 h: 5.8 ± 1.2 µg/L, 12 h: 6.7 ± 0.5 µg/L, 24 h: 8.3 ± 0.7 µg/L, 72 h: 10.8 ± 1.2 µg/L, 7 d: 4.8 ± 0.9 µg/L.
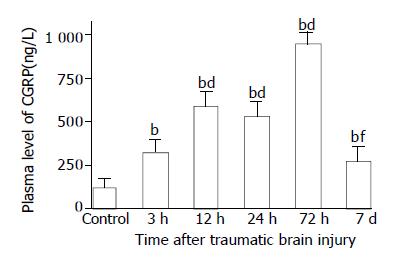
Figure 4 Alteration of CGRP in plasma after TBI.
Compared with control, plasma level of CGRP was significantly increased postinjury, and peaked at 72 h, then declined obviously on d 7 with the value still significantly higher than that of control. bP < 0.01 vs control; dP < 0.01 vs 3 h; fP < 0.01 vs 12 h, 24 h and 72 h. Mean ± SD of 6 animals, control: 120.8 ± 47.7 ng/L, 3 h: 323.8 ± 75. 9 ng/L, 12 h: 596.7 ± 82.7 ng/L, 24 h: 536.0 ± 77.2 ng/L, 72 h: 955. 0 ± 63.0 ng/L, 7 d: 273.3 ± 83.8 ng/L.
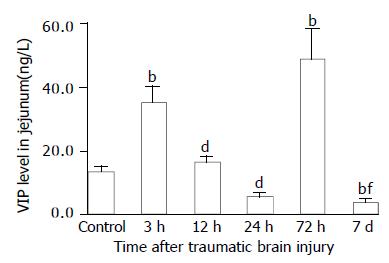
Figure 5 Alteration of VIP levels in all layers of jejunum after TBI.
Compared with control, the level of VIP was significantly increased at 3 h following TBI, then declined markedly at 12 h and 24 h, and was significantly increased again at 72 h, but was at its lowest level on day 7 postinjury. bP < 0.01 vs control; dP < 0.01 vs 3 h; fP < 0.01 vs 3 h and 12 h.
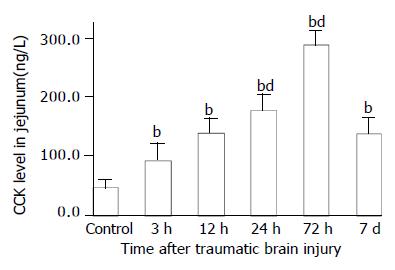
Figure 6 Alteration of CCK levels in all layers of jejunum after TBI.
The level of CCK was significantly increased after TBI as compared with that of control, and peaked at 72 h postinjury, then declined to some degree but was still signifi-cantly higher than that of control on d 7. bP < 0.01 vs control; dP < 0.01 vs 3 h. Mean ± SD of 6 animals, control: 46.5 ± 13.9 ng/g, 3 h: 92.6 ± 28.7 ng/g, 12 h: 139.8 ± 24.7 ng/g. 24 h: 178.5 ± 25.8 ng/g, 72 h: 286.8 ± 25.9 ng/g, 7 d: 137.8 ± 27.3 ng/g.
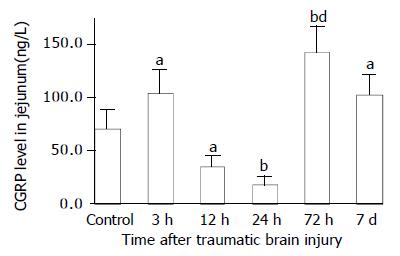
Figure 7 Alteration of CGRP levels in all layers of jejunum after TBI.
Compared with control group, the level of CGRP was significantly increased at 3 h, then declined significantly at 12 h and 24 h, and significantly increased again at 72 h postinjury, then declined on d 7, but was still significantly higher than that of control. aP < 0.05 vs control; bP < 0.01 vs control; dP < 0.01 vs 3 h, 12 h, 24 h and 7 d.
- Citation: Hang CH, Shi JX, Li JS, Wu W, Li WQ, Yin HX. Levels of vasoactive intestinal peptide, cholecystokinin and calcitonin gene-related peptide in plasma and jejunum of rats following traumatic brain injury and underlying significance in gastrointestinal dysfunction. World J Gastroenterol 2004; 10(6): 875-880
- URL: https://www.wjgnet.com/1007-9327/full/v10/i6/875.htm
- DOI: https://dx.doi.org/10.3748/wjg.v10.i6.875


