Copyright
©The Author(s) 2004.
World J Gastroenterol. Feb 1, 2004; 10(3): 389-392
Published online Feb 1, 2004. doi: 10.3748/wjg.v10.i3.389
Published online Feb 1, 2004. doi: 10.3748/wjg.v10.i3.389
Figure 1 Alignment of amino acid sequences of HBx from six mammalian hepadnaviruses.
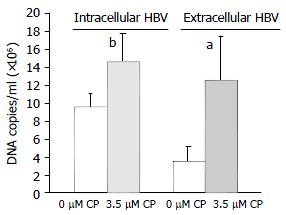
Figure 2 Quantitative detection of HBV DNA by real-time PCR.
HBV DNA levels were significantly increased by 3.5 µM of CP (aP = 0.005, bP = 0.038).
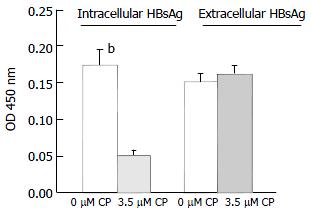
Figure 3 ELISA detection of HBsAg.
Three and a half µM CP could significantly inhibit intracellular HBsAg expression (bP < 0.001).
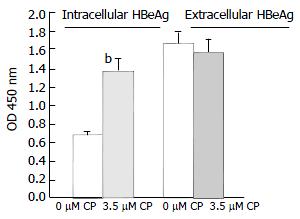
Figure 4 ELISA detection of HBeAg.
The level of intracellular HBeAg was significantly increased by 3.5 µM CP (bP < 0.001).
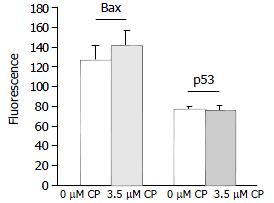
Figure 5 Flow cytometric analysis of Bax and p53 proteins.
- Citation: Song CZ, Wang QW, Song CC, Bai ZL. Viral replication modulated by synthetic peptide derived from hepatitis B virus X protein. World J Gastroenterol 2004; 10(3): 389-392
- URL: https://www.wjgnet.com/1007-9327/full/v10/i3/389.htm
- DOI: https://dx.doi.org/10.3748/wjg.v10.i3.389


