Copyright
©The Author(s) 2004.
World J Gastroenterol. Feb 1, 2004; 10(3): 366-370
Published online Feb 1, 2004. doi: 10.3748/wjg.v10.i3.366
Published online Feb 1, 2004. doi: 10.3748/wjg.v10.i3.366
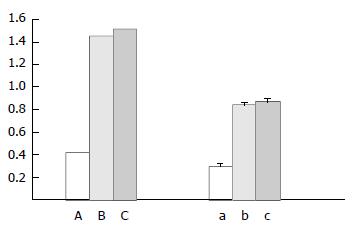
Figure 1 Inhibition effects on HepG2.
2.15 cells of as-hTERT in vitro. A, B and C: Growth inhibition by MTT method. a, b, and c: Inhibitory effects on telomerase activity by PCR-ELISA. A and a: as-hTERT treated cells, B and b: Random sequence treated cells, C and c: Saline treated cells.
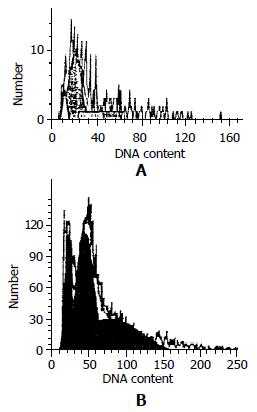
Figure 2 Cell cycle of tumor cells treated with as-hTERT/sa-line in vivo.
A: Cell cycle of tumor cells treated with saline. The apoptosis peak was 7.92%(#). B: Cell cycle of tumor cells treated with as-hTERT. The apoptosis peak was 21.12%(*).
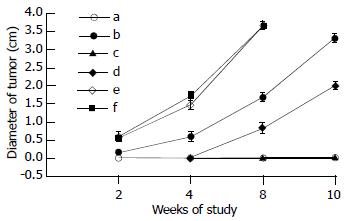
Figure 3 Inhibition effects of tumor cells in vitro.
a: as-hTERT and HepG2.2.15 cells were injected into animals together. There was no tumor growth in ten weeks. So the diameter of tumor was 0 during the whole study period. b: as-hTERT was injected 24 hours postinjection of the cells. Tumor was not grown in animals which were treated with as-hTERT supplementary (c), otherwise (d), tumors grew again, but very slowly. In random (e) and saline control (f), there was no retarding effect on tumorcell growth. Tumors grew very fast, and after eight weeks, the animals died naturally.
- Citation: Liu SX, Sun WS, Cao YL, Ma CH, Han LH, Zhang LN, Wang ZG, Zhu FL. Antisense oligonucleotide targeting at the initiator of hTERT arrests growth of hepatoma cells. World J Gastroenterol 2004; 10(3): 366-370
- URL: https://www.wjgnet.com/1007-9327/full/v10/i3/366.htm
- DOI: https://dx.doi.org/10.3748/wjg.v10.i3.366


