Copyright
©The Author(s) 2004.
World J Gastroenterol. Feb 1, 2004; 10(3): 332-336
Published online Feb 1, 2004. doi: 10.3748/wjg.v10.i3.332
Published online Feb 1, 2004. doi: 10.3748/wjg.v10.i3.332
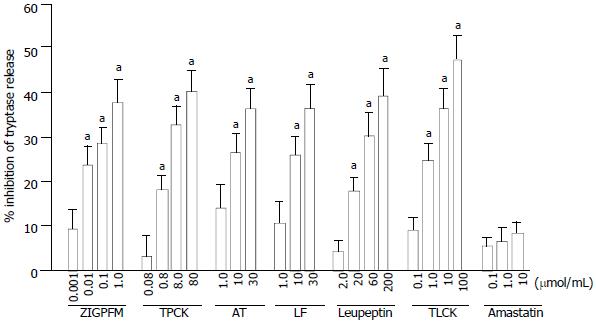
Figure 1 Inhibition of anti-IgE (10 µg/mL) induced tryptase release from dispersed colon mast cells by protease inhibitors.
The inhibitors and anti-IgE were added to cells at the same time (no preincubation). Data are presented as mean ± SEM for four to six separate experiments performed in duplicate. aP < 0.05 compared with the responses with uninhibited controls. AT = α1-antitrypsin; LF = lactoferrin.
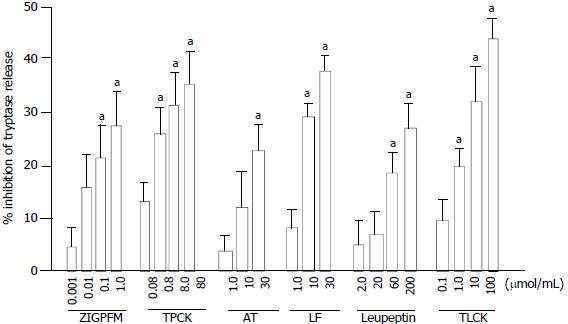
Figure 2 Inhibition of anti-IgE (10 µg/mL) induced tryptase release from dispersed colon mast cells by protease inhibitors.
The inhibitors were preincubated with cells for 20 min before anti-IgE was added. Data are presented as mean ± SEM for four to six separate experiments performed in duplicate. aP < 0.05 compared with the responses of uninhibited controls.
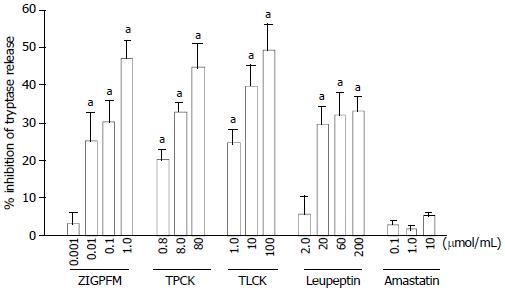
Figure 3 Inhibition of calcium ionophore (1 µg/mL) induced tryptase release from dispersed colon mast cells by protease inhibitors.
The inhibitors and anti-IgE were added to cells at the same time (no preincubation). Data are presented as mean ± SEM for four to six separate experiments performed in duplicate. aP < 0.05 compared with the responses with uninhibited controls. AT = α1-antitrypsin; LF = lactoferrin.
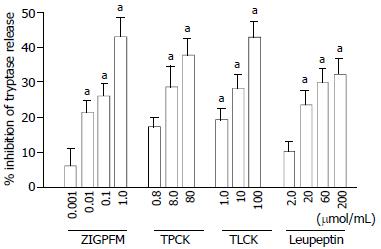
Figure 4 Inhibition of calcium ionophore (1 µg/mL) induced tryptase release from dispersed colon mast cells by protease inhibitors.
The inhibitors were preincubated with cells for 20 min before calcium ionophore was added. Data are pre-sented as mean ± SEM for four to six separate experiments performed in duplicate. aP < 0.05 compared with the responses of uninhibited controls.
- Citation: He SH, Xie H. Inhibition of tryptase release from human colon mast cells by protease inhibitors. World J Gastroenterol 2004; 10(3): 332-336
- URL: https://www.wjgnet.com/1007-9327/full/v10/i3/332.htm
- DOI: https://dx.doi.org/10.3748/wjg.v10.i3.332


